 Source: developed by the authors (2020)
Abimael Ouro [1]
Eucymara Santos [2]
Esdras Santos [3]
Ikaro Barreto [4]
Maria Olave [5]
ABSTRACT
This study looked at how structural equation modeling using partial least squares of higher order has been used in various fields of science. We used the integrative type of systematic review method for this. We used the Coordination for the Improvement of Higher Education Personnel database. We searched this database for articles with eight different descriptors published between 2010 and 2020. In total, we used 173 articles as the basis for our analysis in our study. We used coding and graph analysis through social network analysis to analyze the data. The main findings show that social science is the most commonly used area for this method, and that most studies do not detail how they conducted the higher-order structural equation through partial least squares modeling. The study also shows which metrics are commonly used and which could be used more effectively for greater reliability.
Keywords: SEM-PLS of Higher Order; Second order; Systematic Review; Integrative Review; Social Network Analysis; Quantitative method.
RESUMO
Este estudo analisou como a modelagem de equações estruturais usando mínimos quadrados parciais de ordem superior têm sido usada em vários campos da ciência. Utilizamos para isso o tipo integrativo de método de revisão sistemática. Utilizamos o banco de dados da Coordenação de Aperfeiçoamento de Pessoal de Nível Superior. Buscamos nesta base de dados artigos com oito descritores diferentes publicados entre 2010 e 2020. No total, utilizamos 173 artigos como base para nossa análise em nosso estudo. Usamos codificação e análise de gráficos por meio da análise de redes sociais para analisar os dados. Os principais achados mostram que as ciências sociais são a área mais utilizada para esse método, e que a maioria dos estudos não detalha como conduziram a equação estrutural de ordem superior por meio da modelagem de mínimos quadrados parciais. O estudo também mostra quais métricas são comumente usadas e quais poderiam ser usadas de forma mais eficaz para maior confiabilidade.
Palavras-chave: SEM-PLS de Ordem Superior; Segunda ordem; Revisão sistemática; Revisão Integrativa; Análise de Redes Sociais; Método quantitativo.
SEM-PLS, or structural equation modeling through partial least squares, is a method for analyzing complex interrelationships between observed and latent variables. It is worth noting that the number of publications that use it as a method of analysis has increased in the last ten years (Hair et al., 2019).
According to Dörner and Funke (2017), the twenty-first century is marked by complex and uncertain problems in all areas of knowledge that still need to be researched. Higher-order constructs (HOC), also known as second-order in SEM-PLS, emerge in this context. This type of modeling allows you to connect variables at a higher level that are more abstract to their lower-order sub-dimensions that are more concrete, which is becoming a trend in SEM-PLS research (Sarstedt et al., 2019). It's also been reported that there's a lot of confusion about how to use this model in studies.
Even in studies that conducted a literature review, Ringle et al. (2012) emphasize the importance of further research on SEM-PLS so that its use becomes more valuable and understandable to researchers. Furthermore, the same authors emphasize the need for more research on models with higher-order constructs, because previous studies have used modeling but have not explained how they did it, and knowledge about the use of higher-order constructs is still very limited. According to Hair et al. (2017), studies with higher order constructs have increased significantly, necessitating a better understanding of the metrics involved.
In that direction Ali et al. (2018) , there are many studies directed to specific approaches to science, and as a result, research should focus on science as a whole in order to have a more comprehensive view of the use of this method. In this regard, the purpose of our research is to examine how SEM-PLS with higher order constructs has been used in research in various fields of science. This research aims to contribute to a greater understanding of the use of SEM-PLS with higher order constructs by bringing information about the various ways to use this modeling, thereby assisting researchers who need to use this method in the development of empirical research.
Path models with directly observed variables have been used since the 1930s, mainly in econometrics. From the 1960s onwards, began in the field of sociology, the use of models with latent variables or indirectly observed. This modification opened the way to a new field of statistical inference, and with it methods to estimate parameters of path models with latent variables were developed (Wold, 1980).
Structural Equation Modeling (SEM) first appeared in marketing research in the 1980s, but it gained popularity in the 1990s (Hair et al., 2011). Nonetheless, according to the authors, studies in management are the ones that have used this method the most, because their primary goal is to test theories or concepts. SEM has recently become a near-standard in marketing and management research for analyzing the cause-and-effect relationships between latent constructs (Hair et al., 2011).
SEM is classified into two types: CB-SEM (based on covariance) and PLS-SEM (based on likelihood) (partial least squares). The CB-SEM attempts to reproduce the theoretical covariance matrix while ignoring explained variance (Hair et al., 2011). PLS-SEM, on the other hand, employs a causal modeling approach with the goal of maximizing the explained variance of the dependent latent constructs (Hair et al., 2011).
The PLS approach is the focus of our research. This method is primarily intended for multidisciplinary and other applications where the problems being investigated are complex and theoretical knowledge is limited. There are three factors at play: (a) causal predictive analysis, (b) the complexity of the problems investigated, and (c) a scarcity of prior theoretical knowledge (Wold, 1980).
Also, according to the aforementioned author, one of the PLS's strengths is its model's flexibility; the basic design of the PLS's "smooth modeling" is malleable to the problem under analysis because of the flexibility of the arrow scheme. When observables are organized into blocks for indirect measurement of latent variables, the composition, number, and size of the blocks, as well as the number and structure of internal relationships, are all flexible.
In recent years, according to Crocetta et al. (2021) , HOCs have become very popular in the context of SEM-PLS models in recent years as explicit representations of multidimensional constructs that exist at a higher level of abstraction and are related to other constructs at a similar level of abstraction, completely mediating the influence on or from its underlying dimensions. HOC models are typically distinguished by the number of levels in the model (which is often limited to second-order models) and the various relationships between HOCs and lower-order constructs or LOCs (reflective and formative relationships).
As a result, the relationship between HOCs and LOCs is a question of model nature rather than causality, because HOCS (the general concept) does not exist without its LOCs (dimensions). If the HOC is reflexive, the general concept is manifested by a number of specific dimensions, which are themselves latent (unobserved). If the higher-order construct is formative, it is a synthesis of several specific (latent) dimensions into a broad concept (Crocetta et al., 2021).
According to Mikulić and Ryan (2018), determining whether a construct is reflexive or formative presents numerous challenges. The main issue is the exclusion of important items due to non-compliance with the reflective model's assumptions (high correlation between items, unidimensionality, and divergent validity), when this construct could be considered formative. Suoniemi et al. (2012) also argue that current thinking about formative constructs assumes that the items form the construct in all possible ways, which is unrealistic given that formative constructs can only form a portion of the construct and not the entire construct.
There are four types of HOC in this sense: a) reflexive-reflexive, b) reflexive-formative, c) formative-formative, and d) formative-reflexive. It is understood that a LOCs or HOCs is reflexive if the items or LOCs represent LOCs or HOCs, respectively, and formative if they constitute LOCs or HOCs. If HOCs are reflexive, the general concept manifests itself through several specific unobservable dimensions. HOCs is the combination of several specific dimensions within a concept if it is formative. Many estimation methods have been proposed to estimate these HOCs, including the repeated indicator method, two-stage method, embedded two-stage method, disjoint two-stage method, and extended two-stage method, among others (Sarstedt et al., 2019). However, the first two are more commonly used (Crocetta et al., 2021).
For Crocetta et al. (2021), the first and most popular approach is the Repeated Indicators method, in which the indicators of the LOCs are used as the observable variables of the HOCs. The two-stage method is divided into two phases: first, the latent variables are estimated without the HOCs, and then the SEM-PLS algorithm is run, with the latent variables estimated in the previous step serving as the observed variables of the HOCs. However, due to issues with the predictive power of the models, other estimation methods have recently been proposed to overcome such issues (Crocetta et al., 2021).
Our study employs an integrative review, which is one of the various types of systematic reviews. This method focuses on reviewing empirical study methods, and the article sample may include quantitative, theoretical, and methodological research (Botelho, Cunha e Macedo, 2011). Because we are focusing on the SEM-PLS method, we have chosen to include articles in the research that address this analysis technique, which can be a quantitative empirical study, a literature review that addresses the method, or a study that analyzes the method parameters.
The integrative review, according to Botelho, Cunha and Macedo (2011) , consists of six steps. These are: question formulation, study location, critical evaluation of studies, data collection, data analysis and interpretation, and knowledge synthesis. The question we want to answer is, "How has SEM-PLS with higher order constructs been used in research in various fields of science?"
We base our search strategies on this question. The database chosen was CAPES journals, which has over 48,000 titles, 64 Theses and Dissertations databases, and over 275,000 documents available for research (Siqueira, 2020). We used the following descriptors for the study, as shown in table one:
Table one- Descriptors used in the ResearchSource: developed by the authors (2020)
The second point was to define what would be the inclusion or exclusion criteria of the articles (Botelho, Cunha e Macedo, 2011). The first point seen was temporality, we decided to observe the scientific production between the years 2010 to 2020. The second criterion was the reliability of this production, for this reason we chose only peer-reviewed articles. In the third stage, critical evaluation of the studies (Botelho, Cunha e Macedo, 2011), we analyzed by title and abstract using the Mendeley Desktop software, which is a bibliographic reference manager, we also observed if there was duplication and read the articles in full, to identify if they addressed the second-order SEM-PLS as a method. Graph one demonstrates the use of filters
Graph one - Identification of the Filters used in the Research
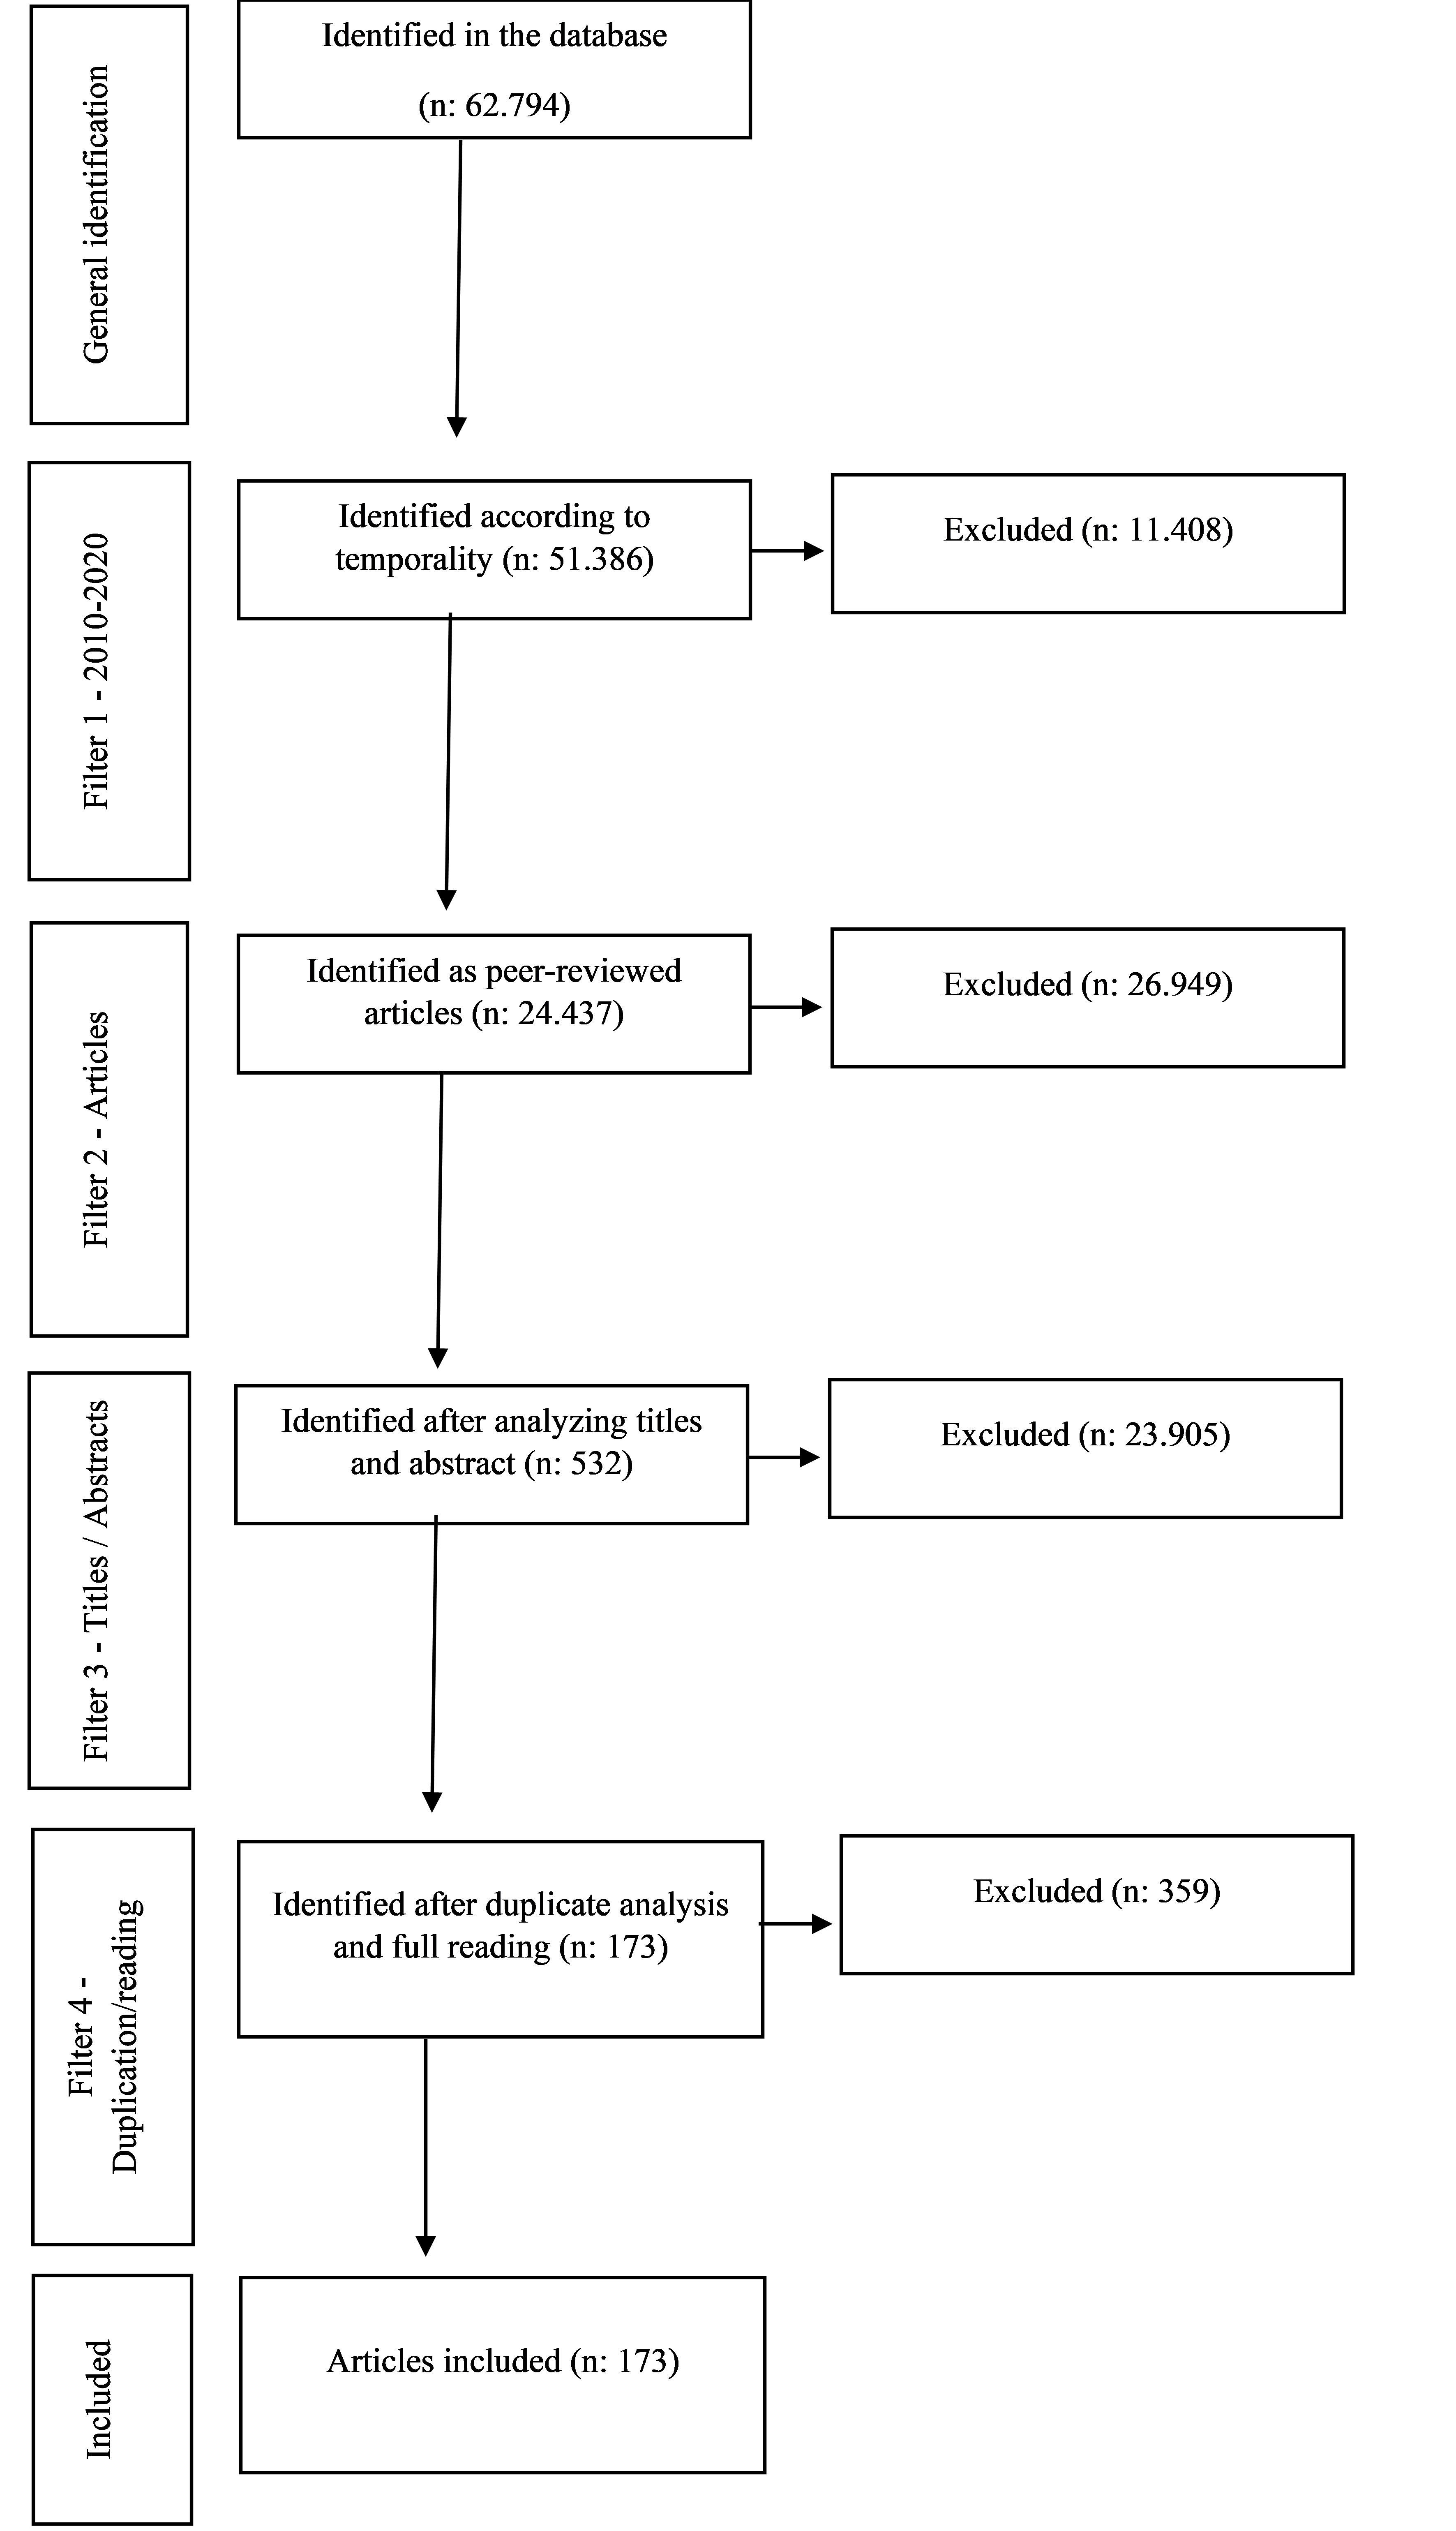
Source: developed by the authors (2020)
The EXCEL system was used in the fourth step of the review, where the techniques of Wickham et al. (2012) , which consist of creating predefined drop-down menus in categories to ensure the use of a consistent set of codes, which were used for data collection in each of the included articles, were used. We use a quantitative approach through graph analysis to develop phases five and six, data analysis and interpretation, and knowledge synthesis, as described by by Botelho Cunha and Macedo (2011).
A quantitative approach in this context seeks to economically summarize the data from a single estimate in order to give strength and direction to the result found (Booth, Sutton e Papaioannou, 2016). We will use social network analysis to accomplish this (SNA). Graphs, according to the authors mentioned above, can make an important contribution to synthesis, pattern identification, and visualization of part or general relationships. This type of analysis employs an exploratory approach to the meanings, contexts, and temporal changes in a large number of articles (Paranyushkin, 2019).Betweenness centrality, which measures the number of node pairs whose shortest connection path passes through the target node (Brandes, 2001); degree of centrality, which identifies the number of connections in which the node is involved (Williams et al., 2015); and modularity, which identifies groups of nodes whose mutual connections are denser than their connections with the rest of the network (Paranyushkin, 2011).
We used InfraNodus software for this analysis, which organizes the text in a network, developing connections between existing words (Paranyushkin, 2019). We use the GEPHI system to aid in the analysis of the InfraNodus network, which allows for various statistical analyses of SNA in a network as well as visualization of this network based on each analysis generated (Bastian, Heymann e Jacomy, 2009).
The bibliographic research on the SEM-PLS technique was conducted over a 10-year period, beginning in 2010. In the qualitative evaluation, a significant increase in the publication of articles using the aforementioned technique was observed in the year 2015, which was also confirmed by Hair et al. (2019) , with progressive increases in the following years. The technique is most commonly used in business and management, marketing, tourism, psychology, and health; however, in 15% of the analyzed articles, a specific area could not be identified.
The majority of articles reveal the type of factor analysis used, with 64% using confirmatory, exploratory, or both. In terms of estimation methods, only half of the works declare the method addressed in the study, with the most common being repeated indicator and two-stage, and the most common types of models being reflexive-reflexive and formative-reflexive, as evidenced by 67 percent of the works.
The authors do not explain how the higher-order method was used in 71% of the works, making it difficult to replicate the studies and understand the proposed relationships. The constructions are generally based on the use of 24, 32, or 42 observed variables, which varies widely between studies. In terms of latent variables, studies typically use 4 to 8 in the first order, and 1 to 4 in the second order. In 82.7 percent of the studies examined, the psychometric scale was the most commonly used scale. In nearly 77 percent of the analyzed works, the analyses were carried out using the SmartPLS program.
The factor loading (69.4 percent) with a cut-off point of 0.7, with the application of Bartlett's correction, was the most commonly used indicator for quality assessment and model adjustments, demonstrating that it is the most common test to analyze how much information indicators bring to the constructs (Hair et al., 2020). The composite reability (CR) with a cut-off point of 0.7 is used in 84.4 percent of the studies for discriminant validity in measurement models, whereas Cronbach's Alpha () with a cut-off point of 0.7 is used in 65.3 percent of the studies. With this, the studies have used the CR more in relation to the reliability test of the constructs, which proves to be statistically more robust (Hair et al., 2020).
The analyzed studies also attempted to observe convergent validity in the measurement model analysis, with nearly 84 percent of the studies employing the AVE with a cut-off point of 0.5. Because the VIF does not apply to this research model in 80.9 percent of the cases, we can conclude that the vast majority of the models proposed in the studies are reflective in nature (Hair et al., 2020).
The research of Henseler et al. (2015) emphasizes the HTMT test as the best for analyzing discriminant validity; however, the HTMT was not used by 80 percent of the authors. Furthermore, the authors claim that the cross-loading and Fornell Larcker tests do not have the same robustness as the HTMT, but research (65.3 percent) still favors this test.
The study of Hair et al. (2012) , while effect sizes that consider the model as a whole (R² and Q²) and observe the impact of exogenous variables on endogenous variables were very common in research, predictive effects that demonstrated individual importance (f² and q²) of each construct in the model were rarely used. Our research results show that these two types of models are on par today, with the following results: R2 (70%), Q2 (44.5%), f2 (93.6%), and q2 (92.5%).
The studies examined here are also consistent with the findings of Streukens e Leroi-Werelds (2016) , who reported the importance of resampling as bootstrap in SEM PLS for model inferences and still advocate for more than 10,000 replicates. Our findings show that not all studies were bootstrapped, with 68.8 percent employing 5,000 resamplings.
The interconnectivity of the network between the abstracts of the articles is the first point to be examined; according to Paranyushkin (2011) the greater the interconnectivity, the more cohesive the discourse between the abstracts. The calculation of the network's average path length, according to the aforementioned author, informs us about this point. Where 0 represents the maximum interconnectivity and the result of the number of nodes divided by four represents the minimum connectivity, indicating that the themes are dispersed. Because there are 150 nodes in our network, the minimum connectivity is 37.5. Our interconnectivity was 1.877, demonstrating that all articles orbit the same central concept, in this case the second-order SEM-PLS. Figure 01 depicts this.
The analysis of betweenness centrality allows us to see how frequently a node appears at random between two nodes in the network (Paranyushkin, 2011). According to the author, in a text analysis context, this measure is more important than degree because it investigates the influence of specific words in a broader context. When the degree of a word is counted, it can have a high index of connections in a small grouping of the text, whereas the betweenness centrality examines the influence of certain words in the entire text. In our network, the first five words with the highest betweenness centrality, in descending order, are: "relationship," "model," "plssem," "construct," and "order." In addition to the words plssem, model, and order that represent the method we focus on, the words' relationship' and 'construct' are also closely related to the method, as it measures the relationship between variables/constructs.
Fig. one - Interconnectivity of abstracts
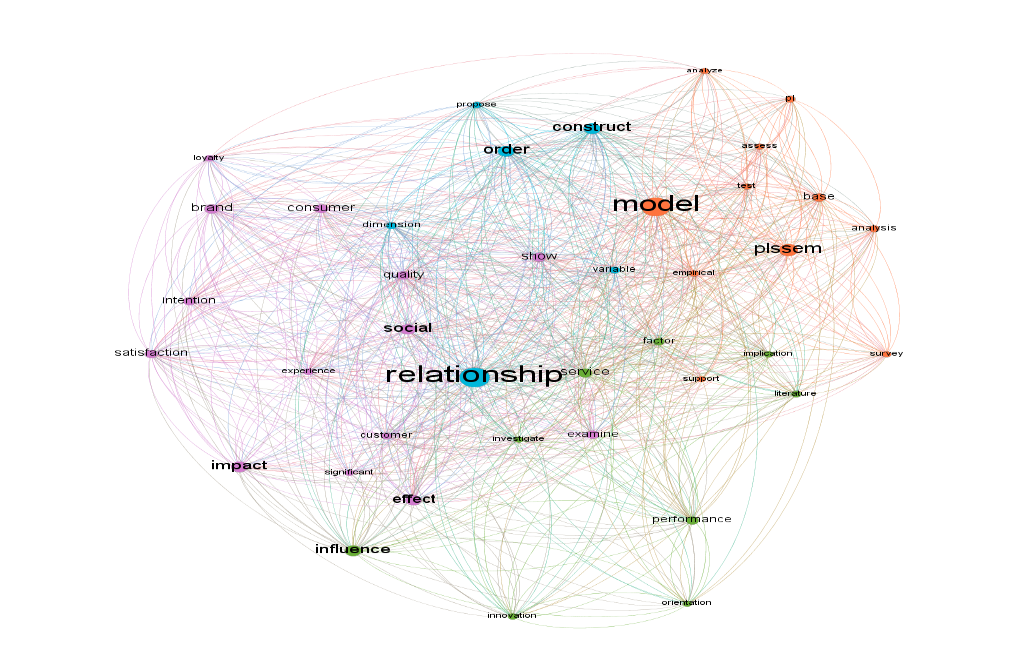
The other five words with the highest betweenness centrality are "influence," "impact," "Social," "effect," and "brand." We thought it would be interesting to highlight these words to show how the Second Order SEM-PLS is used in another research. The words influence, impact, and effect show that the studies are attempting to understand the relationships between the variables, which is the logic behind using this method. The words social and brand attract attention because they indicate that studies are being conducted for social research, particularly in relation to brands, which are most likely related to advertising or marketing.
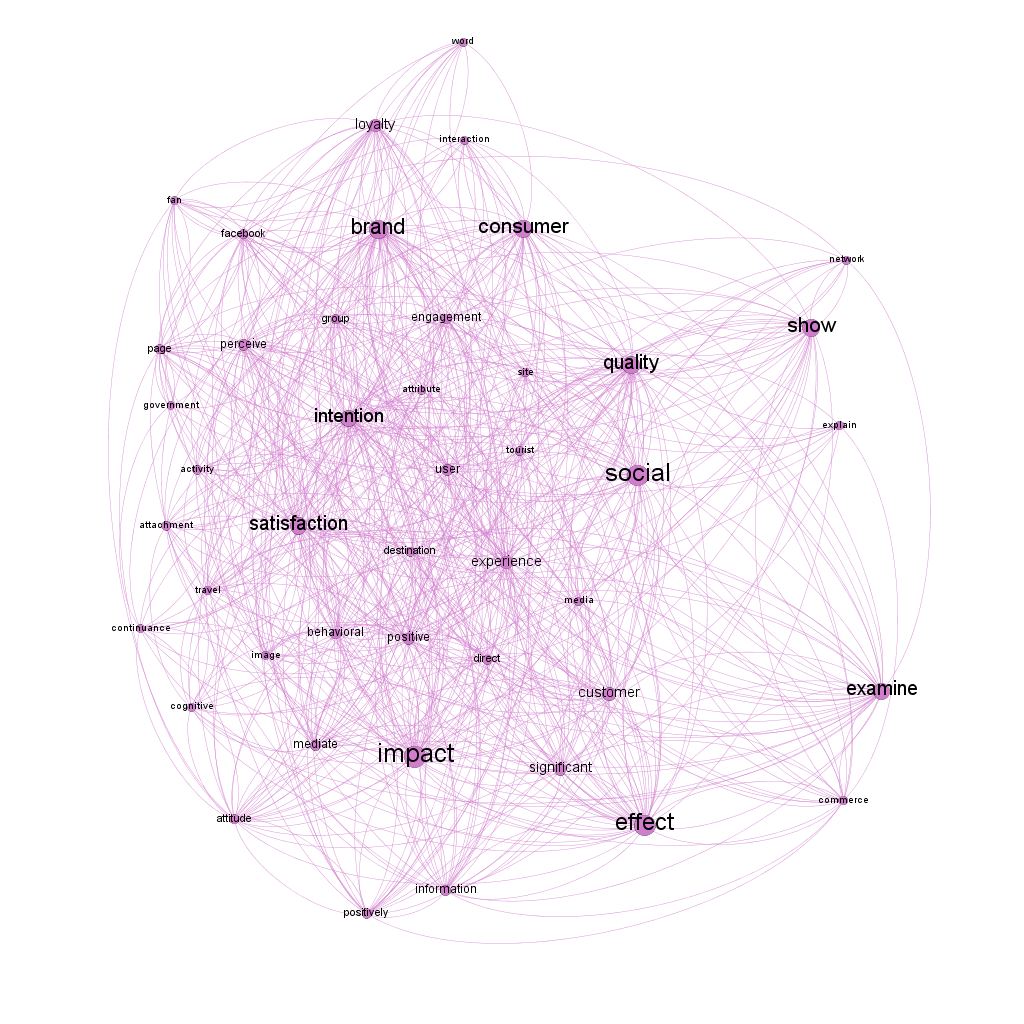
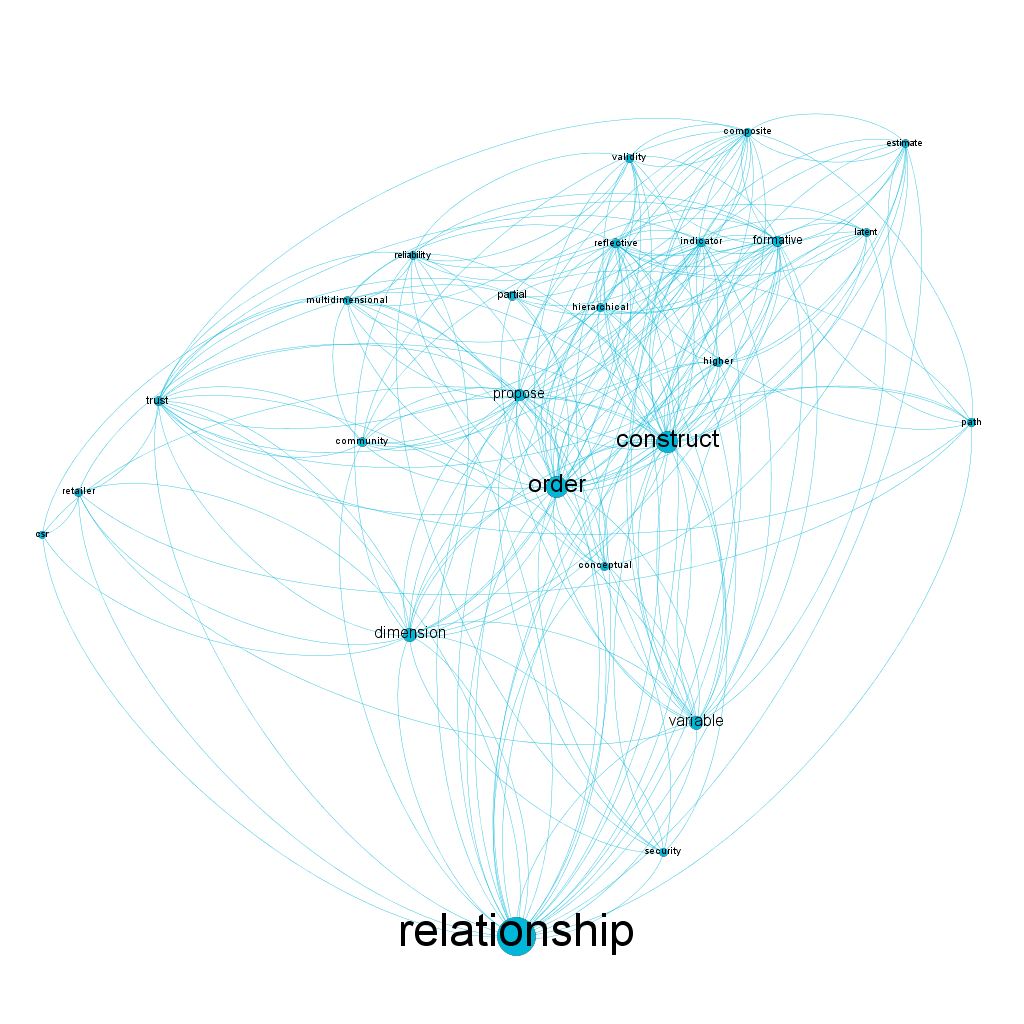
Another analysis is based on modularity, which identifies clusters of nodes that are more connected to each other than to the rest of the network (Paranyushkin, 2011). According to Paranyushkin [27], abstract bias can be classified as focused because it has a modularity less than 0.2 (0.144) and important words are related to communities; these findings are consistent with the focus of our research, i.e. they used the same method. Our data highlights four clusters: Cluster 1 (figure two) accounts for 30% of the network nodes
Clearly, this grouping is focused on the findings of the chosen research, as evidenced by the words impact, social, and examine, among others. It is worth noting that studies that use SEM-PLS focus on the context of social research, with words such as social, consumer, tourist, behavior, user, experience, perception, consumer group, trade, and others appearing in this grouping. This result could be due to the complexity of measuring variables in the social context, in which case Hair et al. (2017), reports that the second-order SEM-PLS can better analyze complex variables. The second group follows the same path as the first, with relevance to social research but a greater emphasis on business, as shown in Figure three.
Fig. two - Grouping on research
We emphasize in this grouping, which accounts for 27.33 percent of the nodes, that the studies focus on micro and small businesses, with the main goals being the observation of organizational performance as well as the influence of variables. We also highlight some research topics that emerge, such as knowledge, management, innovation, technology, internationalization, strategy, service sector, sharing, and environmental concern, among others. Despite addressing several themes, it is clear that some themes that could be included in this scope are missing, such as entrepreneurship, learning, and culture, among others, which fit as complex themes to be measured. The last two groups (figure four and five) account for 42.67 percent of the total (26 percent and 16.67 percent respectively). Thus, while the previous two focused on the research objective, these two share the methodology used in the research.
Fig. three - Grouping on business
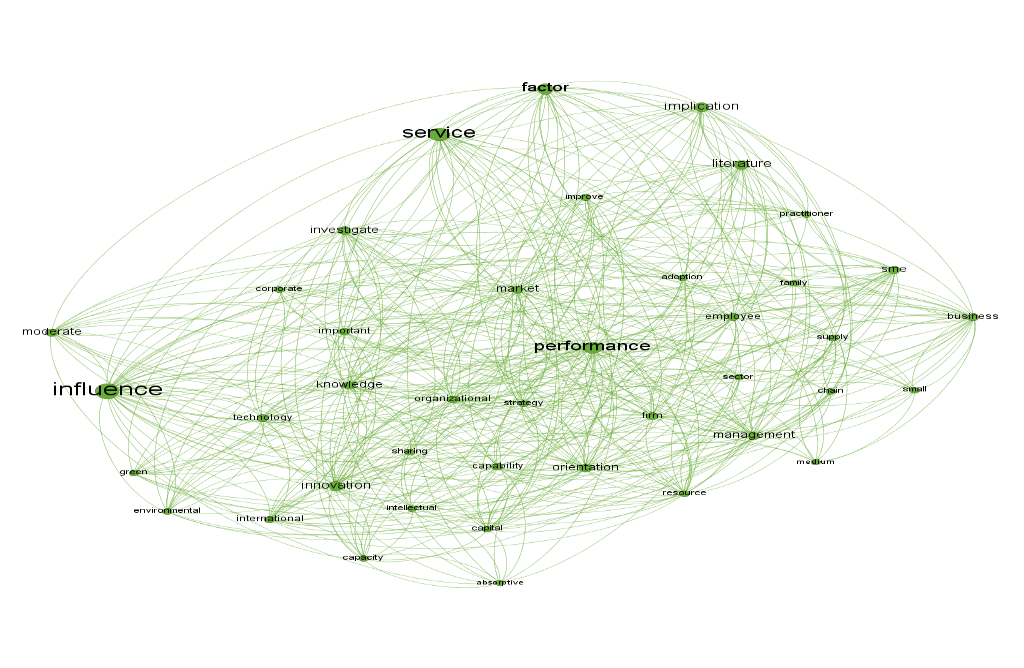
Fig. four - Grouping on research objective 1
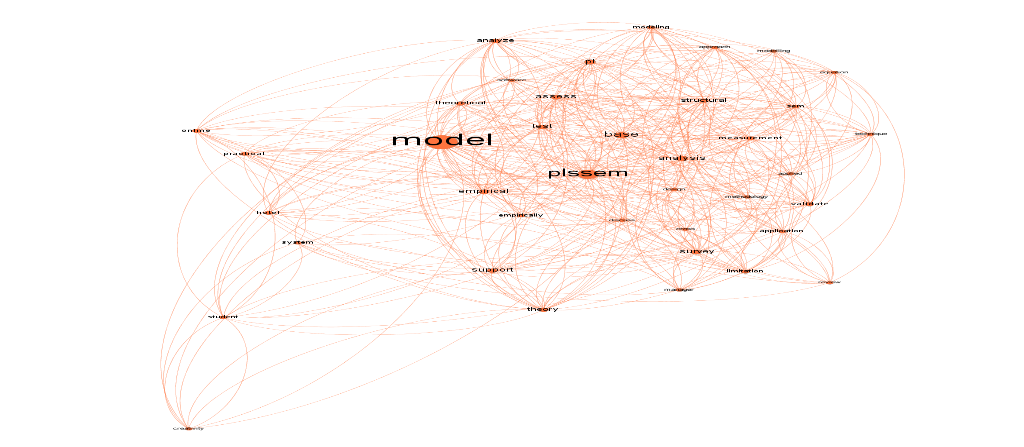
Fig. five - Grouping on research objective 2
The authors' lack of clarity when explaining the use of the second-order SEM-PLS technique stands out. Only the words "order," "hierarchical," and "higher" are described; however, the word "order" is not entirely associated with the second order; it can also refer to the first order. Another factor to consider when employing the second-order technique is the type of second-order employed. The article abstracts do not clearly show which types are used, and none are found in the word networks.
When we looked at the network of authors, the database gave us a network with 462 nodes and 1436 edges. So, we have a network of 462 authors, the vast majority of whom have only published a single article. However, as shown in Figure six, it was possible to observe the formation of a small structured network among some authors who research and use this methodology.
Fig. six - Authors network
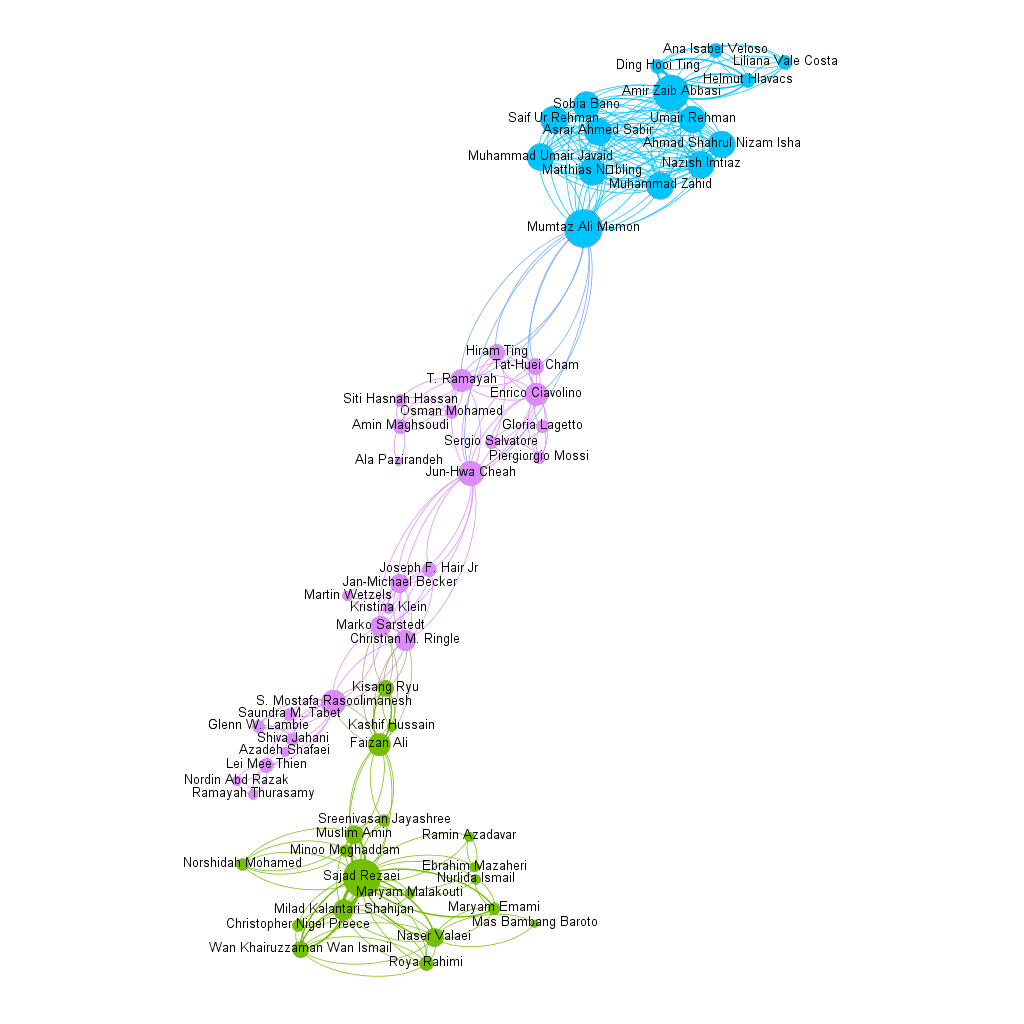
To identify the main actors in the author network analysis, we used the same method as Kane, Mishra and Dutta (2016) According to the authors, the data must first be prepared. They were organized in a CVS table, the authors by article, and imported into the GEPHI, and then the sociometry was calculated, where we discovered the centrality indices. The next step was to find the clusters; in this case, a single cluster was discovered, with authors from various published articles. The final step is to identify the key players in this network.
When analyzing degree centrality, we seek to understand which node is most connected to other nodes in the same network and vice versa, with the node size being formed by this metric (Kane, Mishra e Dutta, 2016), in our case, the author or authors who published the most with other authors. The two authors with the most publications, Mumtaz Ali Memon and Sajad Rezaei, deserve special mention.
A faster path is observed in terms of betweenness centrality, which observes the network actor that acts as a bridge between other actors (Van der Hulst, 2009). According to the author, nodes with higher betweenness centrality have greater network power because they can isolate, influence, manipulate, or prevent contact with other nodes. Jun-Hwa Cheah, Faizan Ali, and Mumtaz Ali Memon are the three actors in our network with the highest betweenness centrality, from highest to lowest. Looking at our network, we can see that these three authors are the links between the green, lilac, and blue color groups. Confirming the report of Van der Hulst (2009), these authors play the role of bridging author groups.
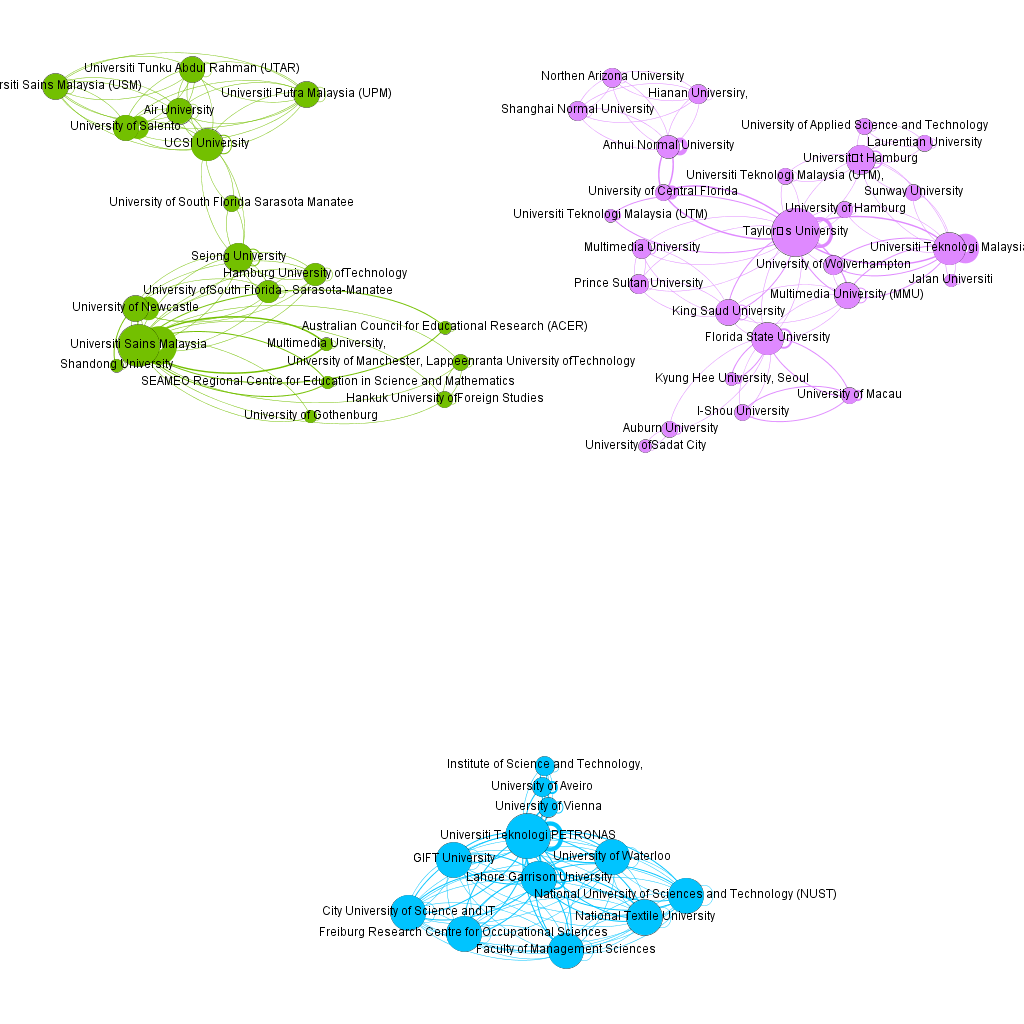
When we observe the existence of a collaboration network between institutions, we highlight Taylor's University as the institution with the greatest number of connections in the network (26). Universiti Teknologi PETRONAS (connection degree: 24), also in Malaysia, was the second most connected institution. The third notable institution is the Universiti Sains Malaysia (Degree of connections: 22). It should be noted that Malaysia is home to the three major universities with the most connections.
Each of the three universities mentioned earlier stands out in its own network. Only these three universities stand out among the 106 clusters discovered, with Taylor's University leading the way, followed by Universiti Sains Malaysia and Universiti Teknologi PETRONAS. We can see that the second and third places are inverted, because what is observed here is the density of these communities in relation to the overall network. We discovered that there are few significant networks, indicating that the network is dispersed when using the second-order SEM-PLS method.
Fig. seven - Collaboration network between institutions
According to Katz e Martin (1997) , research collaboration with other countries has several advantages, including the possibility of sharing and transferring knowledge, skills, and techniques, the development of new ideas, and the stimulation of creativity. Furthermore, collaboration, according to the authors, has the effect of "connecting" countries into a larger network of contacts among members of the scientific community, as well as increasing the visibility of research in each country.
In this same vein, research by Aldieri, Kotsemir and Vinci (2018) shows that international collaboration boosts academic performance while also improving research quality.
Fig. eight - Country Network
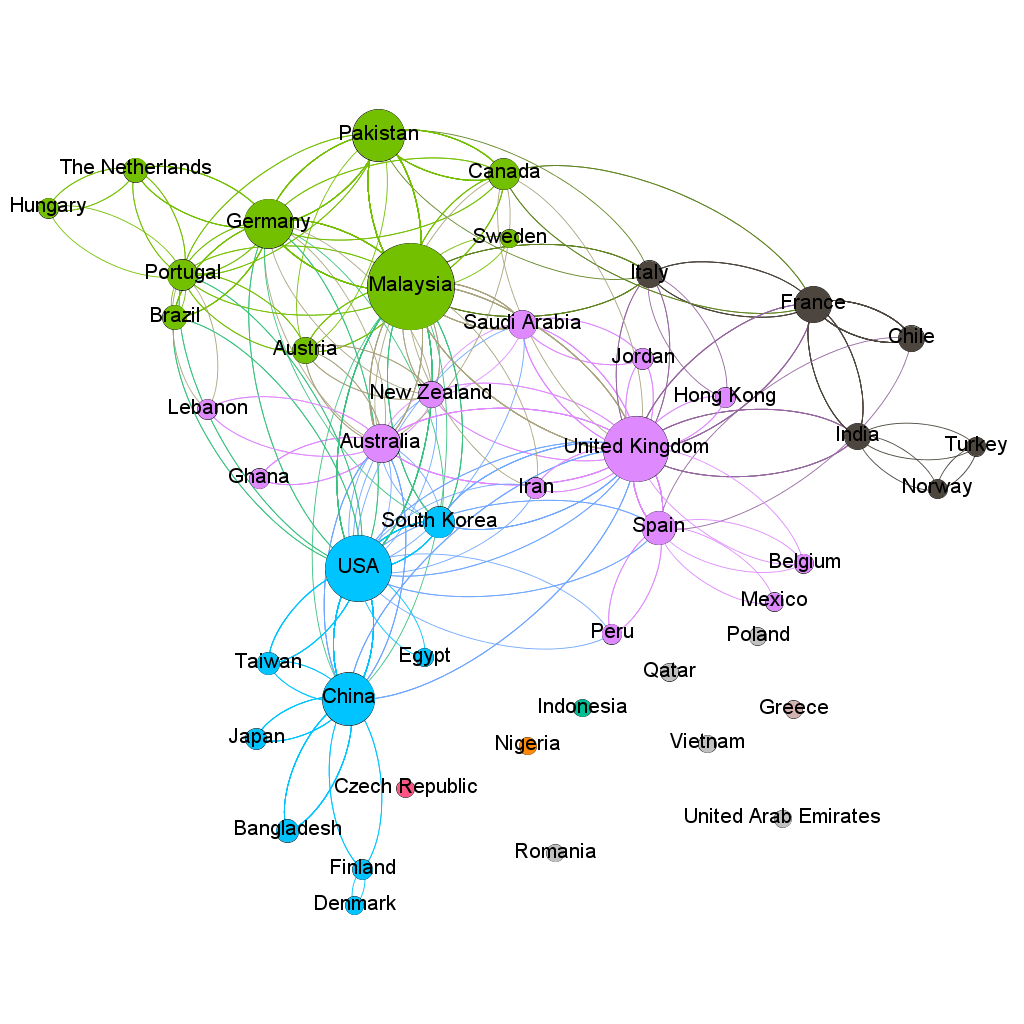
The degree indicates which country has the most direct network connections (Rani, Bhatia e Tayal, 2018). Malaysia (162 degrees), the United States (114 degrees), and the United Kingdom (112 degrees) are the three countries with the most connections when it comes to developing collaborative research using the SEM-PLS second-order methodology. However, in order to find the central nodes, it is necessary to investigate the Betweenness Centrality, which measures the frequency with which a node appears in the path of other nodes (Rani, Bhatia e Tayal, 2018). In our research, the United Kingdom and China appear to be the main centers in the network.
Modularity, which measures the strength of the network when divided into subgroups, was also examined, demonstrating when well-formed subgroups exist in the network (Rani, Bhatia e Tayal, 2018). Three distinct clusters emerge, each led by a country with the highest degree indices. It is worth noting that all groupings are highly polarized; none focuses on a specific region of the world; rather, the connections extend from neighboring countries to the other side of the globe. There are still few research connections with this methodology in Brazil, and its degree (16) is considered low, and the Betweenness Centrality (0) is non-existent. That is, while it has some collaborations, it is not yet an expressive country in terms of using this method.
The Modularity test discovered two well-formed subgroups in the network, each with an interconnectivity of 0.017, which is very close to zero, indicating two clusters with high connectivity (Paranyushkin, 2011).
Fig. nine - Method network
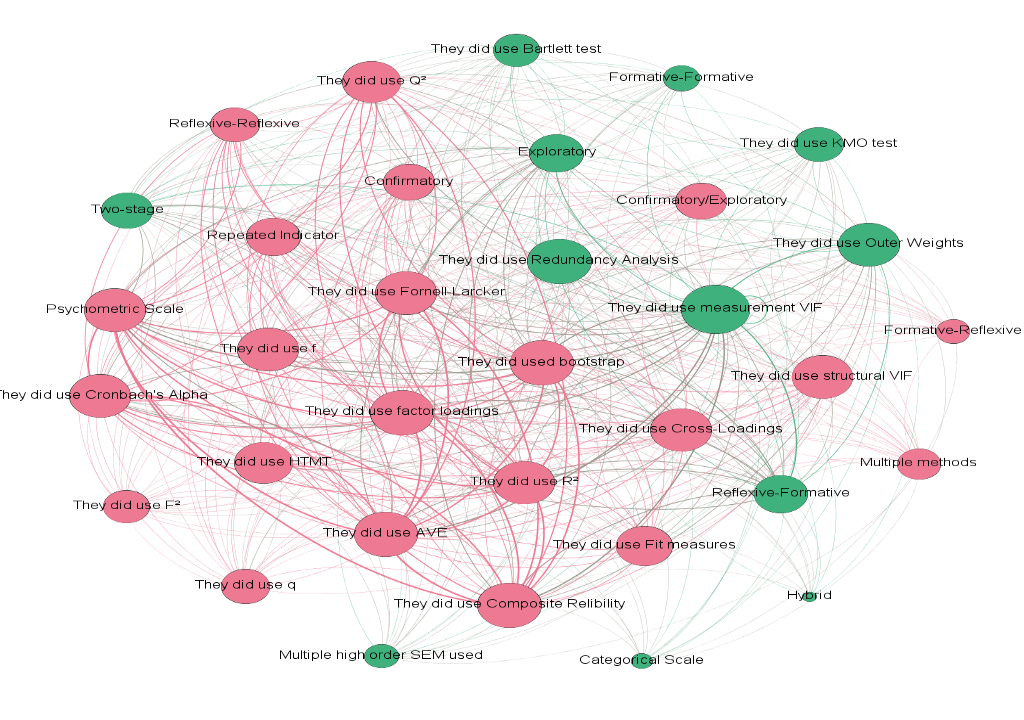
It is possible to identify that each group adheres to one of the models described by Hair et al. (2020), one with the characteristics of a reflective model and another with the characteristics of a formative model. The reflective grouping accounted for 64.71 percent of the network of articles formed by the SEM PLS methods used.
The nodes in this first grouping are as follows: Reflexive-Reflexive, Formative-Reflexive, Confirmatory, Confirmatory/Exploratory, Repeated Indicator, Multiple Methods, Loadings Factor, Composite Relibility, AVE, Cronbach's alpha, Fornell- Larcker, Cross-Loadings, HTMT, Model VIF, Q², R², f, q, Bootstrap measures fit. In addition to the reflective characteristic, as previously stated, these proposed models seek to confirm a theory or explore and confirm, and this result corresponds to what was discovered in the Hair et al. (2012) In contrast to the study of Sarstedt et al. (2019) , in which the vast majority (81.25 percent) seek to estimate the second-order model using the two-stage approach, our research shows a preference for the repeated indicator approach in the grouping of studies with a reflective model. This result can be attributed to the fact that the two types of models in this cluster are simple to apply to the repeated indicator approach (Sarstedt et al., 2019).
Factor Loadings, Composite Reliability, AVE, Cronbach's alpha, Fornell-Larcker, Cross-Loadings, HTMT, model VIF statistics, Q², R², f, q, Hair et al. (2020) describe fit measures and Bootstrap without as being suitable for analysis of measurement measurement models and structural reflective models. Among them, we can highlight Bootstrap, Factorloading, Composite Relibility, and AVE (tied) as the most important nodes in the analysis of the second order SEM PLS (Rani, Bhatia e Tayal, 2018).
The second grouping is much less expressive (35.29 percent of the network) than the first, and its main feature is the formative model, with the following nodes standing out: Formative-formative, Reflective-formative, multiple type of high order SEM, exploratory, Bartlett test, KMO test, two-stage, hybrid, categorical scale, Outer Weights, measurement VIF, redundancy test.
The approach used in this context was a two-stage one, according to the research Sarstedt et al. (2019) and it has long been used in both reflective and formative models. According to our review, we can highlight the Bartlett and KMO tests in this grouping, which are tests that determine the relationship between the indicators and are usually performed a priori as the indicator variables (Hadia, Abdullah and Sentosa, 2016).
Thus, the statistic that follows the model's characteristic, like the previous group, conforms to Hair et al. (2020) being Outer Weights, measurement VIF, and redundancy test, test linked to formative models. The most important analysis tests were measurement VIF and redundancy test, which had the highest Betweenness Centrality in this cluster (Rani, Bhatia e Tayal, 2018).
This study allowed us to confirm the increase in the number of works that have used SEM-PLS as a method to analyze the complex interrelationships between observed and latent variables, as well as to test hypotheses in a variety of fields of knowledge. The growing use of SmartPLS in areas such as applied social sciences, specifically marketing studies, has demonstrated the model's robustness and applicability.
According to our findings, the main areas where the second-order SEM-PLS technique is used are business and management, marketing, tourism, psychology, and health. The vast majority worked in the social sciences. In terms of the type of analysis chosen, the majority of them employ factor analysis. Whether confirmatory, exploratory, or a combination of the two. The repeated indicator and two-stage estimation methods were the most popular.
The analyses conducted with the selected studies highlight an important point: the fact that the majority of the studies (71%) do not explain how the higher-order method was carried out, making it difficult to understand the proposed relationships and reducing the reliability of the studies. At this point, the question arises: what are the reasons why researchers who use the method do not explain the procedures used, allowing replication of studies?
Other quality assessment research results show that factor loading with the application of Bartlett's correction was the most common indicator found in the analyzed works. In agreement with Hair et al. (2020), one of the most cited authors on this topic, the discriminant validities in the measurement models mostly use composite reability (CR) rather than Cronbach's Alpha (α).
When analyzing the networks of authors, we found that the largest number of publications on the subject were made by Mumtaz Ali Memon and Sajad Rezaei. The three authors with the highest betweenness centrality are Jun-Hwa Cheah, Faizan Ali and Mumtaz Ali Memon, showing that they are the bridge between groups of researchers and their peers. On the other hand, countries such as Malaysia, the United States and the United Kingdom have the largest number of connections between researchers or institutions that work with the second-order SEMPLS method, despite the United Kingdom and China being the main centers of the network.
We emphasize the importance of expanding the studies to include higher order constructs. The systematic review found that using PLS is preferable, particularly when it is unknown whether the data is based on a common or composite factor.
As a limitation of this work, it should be noted that the research was chosen and conducted in a single database called Periódicos Capes, despite the fact that this database contains a large number of titles, theses bases, dissertations, and documents. We propose continuing with this research focus, being able to advance with studies that classify SEM-PLS research by knowledge areas, identify and detail the procedures that allowed the classification as second order, classify the most common types of errors found in SEM-PLS research, or even measure the degree of complexity of the problems under study. In addition to other studies on the main software used for research development with second order SEM-PLS.
Without a doubt, this study confirmed that SEM-PLS is a sophisticated technique that can be used to conduct analyses in a variety of fields where complex problems necessitate some degree of refinement. At this point, we emphasize that the researcher must be well-versed in the technique and its details in order to consider other peculiar aspects that are useful in deciding whether or not to use the second-order SEM-PLS, as well as the software used for calculations and analyses.
References
ALDIERI, L.; KOTSEMIR, M.; VINCI, C. P. The impact of research collaboration on academic performance: An empirical analysis for some European countries. Socio-Economic Planning Sciences, v. 62, p. 13–30, 2018.
ALI, F.; RASOOLIMANESH, S. M.; SARSTEDT, M.; RINGLE, C. M.; RYU, K. An assessment of the use of partial least squares structural equation modeling (PLS-SEM) in hospitality research. International Journal of Contemporary Hospitality Management, v. 30, n. 1, p. 514–538, 2018.
BASTIAN, M.; HEYMANN, S.; JACOMY, M. Gephi: An Open Source Software for Exploring and Manipulating Networks. Icwsm, p. 361–362, 2009.
BOOTH, A.; SUTTON, A.; PAPAIOANNOU, D. Systematic Approaches to a Successful Literature Review. 2. ed. London: SAGE, 2016. v. 34
BOTELHO, L. L. R.; CUNHA, C. C. DE A.; MACEDO, M. O MÉTODO DA REVISÃO INTEGRATIVA NOS ESTUDOS ORGANIZACIONAIS. GESTÃO E SOCIEDADE, v. 5, p. 121–136, 2011.
BRANDES, U. A faster algorithm for betweenness centrality. Journal of mathematical sociology, v. v. 25, n. n. 2, p. 163–177, 2001.
CROCETTA, C.; ANTONUCCI, L.; CATALDO, R.; GALASSO, R.; GRASSIA, M. G.; LAURO, C. N.; MARINO, M. Higher-Order PLS-PM Approach for Different Types of Constructs. Social Indicators Research, v. 154, n. 2, p. 725–754, 2021.
DÖRNER, D.; FUNKE, J. Complex problem solving: What it is and what it is not. Frontiers in Psychology, v. 8, n. JUL, p. 1–11, 2017.
HAIR, J. F.; HOWARD, M. C.; NITZL, C. Assessing measurement model quality in PLS-SEM using confirmatory composite analysis. Journal of Business Research, v. 109, n. August 2019, p. 101–110, 2020.
HAIR, J. F.; RINGLE, C. M.; SARSTEDT, M. PLS-SEM: Indeed a silver bullet. Journal of Marketing Theory and Practice, v. 19, n. 2, p. 139–152, 2011.
HAIR, J. F.; RISHER, J. J.; SARSTEDT, M.; RINGLE, C. M. When to use and how to report the results of PLS-SEM. European Business Review, v. 31, n. 1, p. 2–24, 2019.
HAIR, J. F.; SARSTEDT, M.; PIEPER, T. M.; RINGLE, C. M. The Use of Partial Least Squares Structural Equation Modeling in Strategic Management Research: A Review of Past Practices and Recommendations for Future Applications. Long Range Planning, v. 45, n. 5–6, p. 320–340, 2012.
HAIR, J. F.; SARSTEDT, M.; RINGLE, C. M. Rethinking some of the rethinking of partial least squares. European Journal of Marketing, v. 53, n. 4, p. 566–584, 2019.
HAIR, J.; HOLLINGSWORTH, C. L.; RANDOLPH, A. B.; CHONG, A. Y. L. An updated and expanded assessment of PLS-SEM in information systems research. Industrial Management and Data Systems, v. 117, n. 3, p. 442–458, 2017.
HE, J.-H. Variational iteration method–a kind of non-linear analytical technique: some examples. International journal of non-linear mechanics, v. 34, n. 4, p. 699–708, 1999.
HENSELER, J.; RINGLE, C. M.; SARSTEDT, M. A new criterion for assessing discriminant validity in variance-based structural equation modeling. J. of the Acad. Mark. Sci., p. 115–135, 2015.
HULST, R. C. VAN DER. Introduction to Social Network Analysis (SNA) as an investigative tool. Trends in Organized Crime, v. 12, n. 2, p. 101–121, 2009.
KANE, S. N.; MISHRA, A.; DUTTA, A. K. Preface: International Conference on Recent Trends in Physics (ICRTP 2016). Journal of Physics: Conference Series, v. 755, n. 1, 2016.
KATZ, J. S.; MARTIN, B. R. What is research collaboration? Research Policy, v. 26, n. 1, p. 1–18, 1997.
KAUFMANN, L.; GAECKLER, J. A structured review of partial least squares in supply chain management research. Journal of Purchasing and Supply Management, v. 21, n. 4, p. 259–272, 2015.
MIKULIĆ, J.; RYAN, C. Reflective versus formative confusion in SEM based tourism research: A critical comment. Tourism Management, v. 68, n. March 2017, p. 465–469, 2018.
PARANYUSHKIN, D. Identifying the pathways for meaning circulation using text network analysis. Berlim: Nodus Labs, 2011.
PARANYUSHKIN, D. InfraNodus: Generating insight using text network analysis. The Web Conference 2019 - Proceedings of the World Wide Web Conference, WWW 2019, p. 3584–3589, 2019.
RANI, P.; BHATIA, M. P. S.; TAYAL, D. K. An Astute SNA with OWA Operator to Compare the Social Networks. International Journal of Information Technology and Computer Science, v. 10, n. 3, p. 71–80, 2018.
SARSTEDT, M.; HAIR, J. F.; CHEAH, J.; BECKER, J.; RINGLE, C. M. How to specify, estimate, and validate higher-order constructs in PLS-SEM. Australasian Marketing Journal (AMJ, v. 27, p. 197–211, 2019.
SIQUEIRA, T. G. D. S. Possibilidades de pesquisa no Portal de Periódicos CAPES, 2020.
STREUKENS, S.; LEROI-WERELDS, S. Bootstrapping and PLS-SEM: A step-by-step guide to get more out of your bootstrap results. European Management Journal, v. 34, n. 6, p. 618–632, 2016.
SUONIEMI, S.; TERHO, H.; OLKKONEN, R. The Measurement of Endogenous Higher-Order Formative Composite Variables in PLS-SEM: An Empirical Application from CRM System Development. International Journal of Computer, Electrical, Automation, Control and Information Engineering, v. 6, n. 12, p. 1648–1652, 2012.
UL HADIA, N.; ABDULLAH, N.; SENTOSA, I. An Easy Approach to Exploratory Factor Analysis: Marketing Perspective. Journal of Educational and Social Research, v. 6, n. 1, p. 215–223, 2016.
WICKHAM, M.; DUNN, A.; SWEENEY, S. Analysis of the leading tourism journals 1999-2008. Annals of Tourism Research, v. 39, n. 3, p. 1714–1718, 2012.
WILLIAMS, E.; BREWE, E.; ZWOLAK, J.; DOU, R. Understanding centrality: Investigating student outcomes within a classroom social network. Proceedings of the Physics Education Research Conference., p. 375–378, 2015.
WOLD, H. Model Construction and Evaluation When Theoretical Knowledge Is Scarce. Evaluation of Econometric Models, p. 47–74, 1980.
Recebido: 25/10/2022
Aceito: 10/02/2023
------------
[1] Universidade Federal de Sergipe, abimaelmagno@hotmail.com, https://orcid.org/0000-0003-1308-9297.
[2] Universidade Federal de Sergipe, eucymara@academico.ufs.br, https://orcid.org/0000-0001-5674-0911.
[3] Universidade Federal de Sergipe, esdras.adriano@gmail.com, https://orcid.org/0000-0002-3621-1913.
[4] Universidade Federal de Pernambuco, daniel.carvalho.ib@gmail.com, https://orcid.org/0000-0001-7253-806X.
[5] Universidade Federal de Sergipe, mleonolave@academico.ufs.br, https://orcid.org/0000-0002-7367-4896.