
Fair value accounting and financial reporting quality of listed consumer goods firms in Nigeria: moderating role of audit committee
CONTABILIDADE DE VALOR JUSTO E QUALIDADE DOS RELATÓRIOS FINANCEIROS DE EMPRESAS DE BENS DE CONSUMO LISTADAS NA NIGÉRIA: PAPEL MODERADOR DO COMITÊ DE AUDITORIA
Kabiru Isa Dandago [1]
Modibbo Abubakar [2]
DOI: 10.23925/2446-9513.2025v12id71864
ABSTRACT
The study’s relevance lies in testing the effectiveness and efficiency of Nigerian audit committees in mitigating investors' perceptions of estimation errors and bias, which are inherent in fair value accounting. The purpose of the study was to examine the moderating effects of audit committees on the relationship between fair value accounting and the financial reporting quality of listed consumer goods firms in Nigeria. To achieve the objective, both accounting and market quality measures were adopted, including earnings management (discretionary accruals). A correlational research design was employed in a sample of 17 firms from 2012 to 2022. Structural equation modeling was used in the data analysis, and the study found that Level 1 fair value assets have a significant negative impact on financial reporting quality, while Level 3 fair value assets have an insignificant negative effect. The study, on the other hand, found that Level 2 fair value assets and Level 1 fair value liabilities have an insignificant positive impact on financial reporting quality. The findings also revealed that Level 3 fair value assets and Level 2 fair value liabilities have a significant positive impact on financial reporting quality. However, the findings indicated that the audit committee attributes index has a significant moderating effect on the relationship between fair value accounting and the financial reporting quality of listed consumer goods firms in Nigeria. The findings of the study are robust to the potential confounding effect of firm characteristics (firm size and firm age). The study contributed to the debate on the usefulness of fair value accounting by providing policymakers and standard setters with updated empirical evidence originating from a non-Western setting about the post-implementation consequences of fair value accounting adoption
Keywords: Discretionary accruals; Earnings management; Agency theory; Mark-to-market; Mark-to-model.
RESUMO
A relevância do estudo reside em testar a eficácia e a eficiência dos comitês de auditoria nigerianos na mitigação das percepções dos investidores sobre erros e vieses de estimativa, inerentes à contabilidade de valor justo. O objetivo do estudo foi examinar os efeitos moderadores dos comitês de auditoria sobre a relação entre a contabilidade de valor justo e a qualidade dos relatórios financeiros de empresas de bens de consumo listadas na Nigéria. Para atingir o objetivo, foram adotadas medidas de qualidade contábil e de mercado, incluindo gerenciamento de resultados (accruals discricionários). Um delineamento de pesquisa correlacional foi empregado em uma amostra de 17 empresas de 2012 a 2022. A modelagem de equações estruturais foi usada na análise de dados, e o estudo descobriu que os ativos de valor justo Nível 1 têm um impacto negativo significativo na qualidade dos relatórios financeiros, enquanto os ativos de valor justo Nível 3 têm um efeito negativo insignificante. O estudo, por outro lado, descobriu que os ativos de valor justo Nível 2 e os passivos de valor justo Nível 1 têm um impacto positivo insignificante na qualidade dos relatórios financeiros. As descobertas também revelaram que os ativos de valor justo Nível 3 e os passivos de valor justo Nível 2 têm um impacto positivo significativo na qualidade dos relatórios financeiros. No entanto, os resultados indicaram que o índice de atributos do comitê de auditoria tem um efeito moderador significativo sobre a relação entre a contabilização do valor justo e a qualidade dos relatórios financeiros de empresas de bens de consumo listadas na Nigéria. Os resultados do estudo são robustos quanto ao potencial efeito de confusão das características da empresa (tamanho e idade da empresa). O estudo contribuiu para o debate sobre a utilidade da contabilização do valor justo, fornecendo aos formuladores de políticas e normatizadores evidências empíricas atualizadas, originárias de um cenário não ocidental, sobre as consequências pós-implementação da adoção da contabilização do valor justo.
Palavras-chave: Acréscimos discricionários; Gestão de resultados; Teoria da agência; Marcação a mercado; Marcação a modelo.
1. Introduction
Financial reports are vital for communication and decision-making between firms and stakeholders. However, their credibility has been questioned due to corporate scandals worldwide (2001-2020), including Enron, Worldcom, Lehman Brothers, Wirecard, Carillion, Satyam, and Nigeria’s African Petroleum Plc. Such failures have heightened the demand for higher-quality financial reports to address managerial opportunism and information asymmetry.
Fair Value Accounting (FVA) as a new paradigm aimed at enhancing the relevance and transparency of financial information. While proponents argue that FVA improves Financial Reporting Quality (FRQ) by making it more comparable and transparent, critics highlight its potential drawbacks. FVA involves a wide range of estimations, assumptions, and judgments, which can render financial reports "fictional" or "imaginary" and open to manipulation and bias (Andrejcik, D., Singh, G., & Halari, A., 2021). The inherent subjectivity in determining Fair Values (FV), especially for Level 2 (based on observable market inputs) and Level 3 (based on unobservable inputs) assets and liabilities, can lead to inaccuracies and uncertainties in financial reporting. There are two causes of poor financial reporting: weak Corporate Governance (CG) mechanisms (Thesing, J., & Velte, P., 2021), issues with the accounting system, particularly in measurement and valuation practices like FVA. Despite the widespread adoption of FVA, concerns remain about its impact on FRQ, particularly in contexts where it allows managerial discretion and judgment.
The flexibility in the use of different levels of inputs (Levels 1, 2, and 3) for Fair Value Measurement (FVM) can lead to significant room for managerial discretion and bias, potentially impairing FRQ. For example, while Level 1 inputs (observable prices in active markets) are considered highly reliable, Level 2 and Level 3 inputs, which involve more subjective assessments, can increase the potential for earnings management and financial statement volatility. Šodan, S. (2019) states that the main assumption is that level 2 and level 3 inputs are more subjective, contain more measurement errors, and allow managers to use their earnings management practices more often in comparison to level 1 inputs.
The study examines Nigerian consumer goods firms, where financial reporting issues persist despite FVA adoption. Corporate failures like Oceanic Bank, Intercontinental Bank, and Cadbury Nigeria Plc highlight weak governance and regulatory lapses. Audit committees (AC) failed to prevent financial manipulations, as seen in Cadbury’s N13.25 billion overstatement. Several firms, including Seven-Up and UTC Nigeria Plc, faced suspension or delisting from the NSE due to questionable financial practices.
Nigeria's developing market, with weaker regulations and less efficient structures, poses unique challenges for FVA. Managerial opportunism, particularly in using Level 2 and Level 3 inputs, highlights the need for strong CG, especially AC, to moderate FVA impact on FRQ. While FVA aims to enhance FRQ through market-based valuations, it also allows managerial discretion. Limited research exists on how AC attributes (e.g., independence, expertise, meeting frequency) influence this relationship in Nigeria. Unlike developed economies, Nigerian distinct regulatory and market conditions necessitate further exploration of FVA effect on FRQ in consumer goods firms.
Pompili, M. and Tutino, M. (2019) show that impacts of FVA on earning quality do not depend on the level of FV. Ghio, A., Filip, A., and Jeny, A. (2020) reveal that assets and liabilities estimated at FV are usually value relevant, and investors. Nugraheni, B. L. Y. (2023) revealed that independent members and AC educational background can reduce management opportunistic behaviors, which is conducted through FVM.
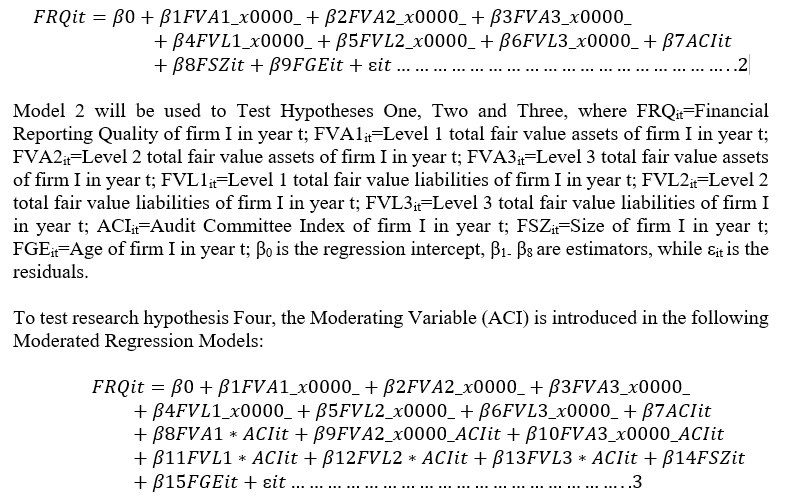
This study aimed to bridge this gap by providing empirical evidence on the moderating role of AC in Nigeria, where market conditions and CG practices differ significantly from more developed economies. The objectives of the study were: 1) to examine the impact of the level 1 fair value assets and liabilities on the financial reporting quality of listed consumer goods firms in Nigeria; 2) to assess the impact of the level 2 and 3 fair value assets and liabilities on the financial reporting quality of listed consumer goods firms in Nigeria; 3) to examine the moderating effect of audit committee attributes on the relationship between the hierarchies of fair value assets and liabilities and the financial reporting quality of listed consumer goods firms in Nigeria.
The following hypotheses are formulated in null form for the study: H01: Level 1 fair value assets and liabilities have no significant effect on the financial reporting quality of listed consumer goods firms in Nigeria; H02: Level 2 fair value assets and liabilities have no significant effect on the financial reporting quality of listed consumer goods firms in Nigeria. H03: Level 3 fair value assets and liabilities have no significant effect on the financial reporting quality of listed consumer goods firms in Nigeria. H04: Audit committee attributes have no significant moderating effect on the relationships between the hierarchies of fair value assets and liabilities, and the financial reporting quality of listed consumer goods firms in Nigeria.
2. Literature Review
This study is underpin by agency theory and institutional theory, which posits that conflicts of interest between managers (agents) and shareholders (principals) can lead to managerial opportunism and earnings manipulation. Strong ACs can help mitigate these agency problems by providing effective oversight of financial reporting.
Chong et al. (2012) examined whether commercial banks manage earnings through the use of Level 3 valuation under SFAS 157. By analyzing 10-Q reports from U.S. commercial banks in early 2008, they found that large and poorly performing banks use more Level 3 inputs for asset and liability valuation, suggesting earnings management. The study highlights that banks may use SFAS 157 for earnings manipulation. Xu (2013) explored the link between FVM and earnings management in U.S. banks from 2009-2012. The study found that banks using higher levels of FVM, particularly Level 2 inputs, are more likely to engage in earnings management. The results also indicated that such banks report smoother earnings over time. Fargher and Zhang (2014) analyzed the impact of relaxed FV standards on earnings quality in U.S. banks. They found that increased discretionary FV assets led to greater earnings management and lower informativeness of earnings. The study’s focus on U.S. banks and pre-2011 data may not fully reflect current conditions. Abubakar et al. (2015) examined the impact of FVM on the quality of accounting earnings in Nigerian banks over 2009-2014. Using a correlational research design and panel regression, the study found that FVA significantly improved earnings persistence and predictive ability but did not enhance earnings smoothing.
Hsu and Lin (2016) explored the manipulation of FV disclosures and earnings management in firms with weak CG. They found that firms with more Level 3 assets were more likely to manipulate earnings to meet forecasts. Šodan (2019) examined the effect of Level 2 and Level 3 FV inputs on earnings volatility in Croatian banks (2011-2016). The study found that higher proportions of Level 2 and Level 3 assets were linked to greater earnings volatility. Pompili and Tutino (2019) explored the impact of Fair Value Accounting (FVA) on earnings quality in US banks from 2011-2016. The study found that the quality of earnings was uniformly affected by the different levels of fair value inputs, with Level 3 inputs not having a more negative impact compared to observable inputs. FVA generally hurt earnings quality, raising concerns about its reliability due to potential earnings manipulation.
Adeyemi and Kargi (2022) examined the impact of FVM hierarchy disclosures on cosmetic accounting in Nigerian banks from 2012-2018. The study found that Levels 1 and 2 reduce earnings manipulation, while Level 3 increases it. Osanyinbi et al. (2023) investigated FVM’s impact on FRQ in Nigerian insurance companies, finding significant positive effects and recommending better adherence to financial reporting standards. Etim et al. (2023) analyzed the influence of fair valuation on earnings management in Nigerian banks from 2015-2021. They found that fair valuation, especially Levels 2 and 3, is significantly used to manage earnings. Nugraheni (2023) examined the impact of CG on opportunistic behavior through FVM in Indonesia, finding that certain governance mechanisms can reduce opportunistic behavior.
Siekkinen (2017) investigated how board characteristics affect the value relevance of FV estimates in European financial firms, finding that board independence and gender diversity increased value relevance, especially for Level 3 FVs. Nicholls (2020) investigated how corporate and country-level governance mechanisms affect the reliability of FV estimates among banks in the EU and Canada, finding that stronger governance improves the perceived reliability of Level 3 FV estimates. Tsadira (2020) explored the effect of FV levels on accounting quality and leverage in European and Norwegian banks, finding that while FV levels are generally value relevant, their quality has improved in some areas but deteriorated in others over time. Kholilah et al. (2023) examined the impact of managerial opportunistic behavior and CG on FVM in Indonesia, finding that opportunistic motivations significantly affect FV use, and governance structures can influence this motivation.
3. Materials and Methods
- Materials and Methods
The study adopts the correlational ex-post facto design. The design is considered suitable because it is very effective in cause-and-effect study; this is consistent with the objectives of this research, which is to determine the impact of AC on the relationship between FVA and FRQ in the listed consumer goods firms. This design is chosen because is consistent with the functionalists’ research paradigm and also in agreement with the quantitative research strategy and the deductive approach adopted in this study. The hypotheses developed based on relevant theory, are to be tested using quantitative data to be collected.
This study applies a two-stage design in which in the first stage a proxy of FRQ is estimated based on the Modified Jones Model by Kothari et al. (2005). In the second stage, the impact of AC on the relationship between FVA and FRQ will be determined. The population of this study covers all the 25 listed companies operating in the consumer goods sector of the NGX Market as of 31st December 2022. This population is considered useful for the study because of the incidences related to FRQ that have been happening in the sector, as it provides an appropriate opportunity to examine the research problem.
The sample size of the study constitutes Seventeen (17) Firms (Cadbury Nig. Plc, Champion Brew. Plc, Dangote Flour Mills Plc, Flour Mill Nig. Plc, Guinness Nigeria Plc, Honeywell Flour Mills Plc, International Brew. Plc, Mcnichols Plc, National Salt Com. Plc, Vitafoam Nig Plc, Nigerian Brew. Plc, Nestle Nigeria Plc, Northern Nigeria Flour Mills Plc, Nigerian Enamelware Plc, PZ Cussons Nig Plc, Unilever Plc, and Union Dicon Salt Plc), which was arrived at using a filter. Five companies (Premier Breweries Plc, Golden Guinness Breweries Plc, Multi-Trex Food Plc, Jos Breweries Plc, and Dangote Flour Mills Plc) were not on the NGX lists for some years during the period covered by the study (2012-2022), and they are dropped. Similarly, BUA Foods Plc was listed on the NGX in 2022, while DN Tyre and Rubber, and P.S. Mandrid Plc were delisted from the exchange.
The study exploits the secondary sources of data to test the research hypotheses and achieve the study's objectives. The choice of secondary data reflects the philosophies of the positivists’ paradigm as well as the norms of the quantitative research strategy adopted. The data were extracted from the audited reports and accounts of the sample consumer goods companies. The data analysis techniques employed in this study have a theoretical relationship with the research objectives and hypotheses stated in previous chapters of the study. The technique employed is Structural Equation Modeling (SEM) of data analysis. This technique is adopted because it allows models with different outcome variables with similar indicators to be estimated. In addition, structural equation modeling assists in overcoming some of the problems associated with the typical classical regression models. Some of the limitations which SEM overcomes include additive property of the regression model and its inadequacy in dealing with measurement errors. It deals with more complex relationships between variables, it shows clearly through the path diagram of the relationships between variables and the specification of alternative models where possible. It uses the path analysis framework to achieve its objective.
To ensure the validity and reliability of our results and findings, robustness tests were conducted. The Shapiro-Wilk test is a useful tool for testing data normality. The null hypothesis principle is used in the Shapiro-Wilk (W) test for normal data, under the principle, the Null hypothesis that ‘the data is normally distributed’ is tested. One of the major regression assumptions is that the variance of the error terms is constant (Homoskedastic). The study used Breuch Pagan/Cook-Weisberg test for the Model of the study to determine the presence of heteroscedasticity or otherwise. Linktest and Ramsey test for model specification were used to check model specification errors, which arise when relevant variables are left out of the model or when irrelevant variables are included. Specification errors can significantly impact the accuracy of the regression coefficients. The Ramsey Test hypothesized the non-existence of omitted variables. Linktest on the other hand is based on the idea that if a regression is properly specified, one should not be able to find any additional independent variables that are significant except by chance. Linktest creates two new variables, the variable of prediction, _hat, and the variable of squared prediction, _hatsq. The model is fit if the _hat is significant since it is the predicted value, and that _hatsq should not be significant, because if the model is specified correctly, the squared predictions should not have much explanatory power. That is _hatsq must not be a significant predictor if a model is specified correctly.
Audit committee attributes as a moderator are captured using an index/score. The use of ACI helps in capturing the multiple dimensions of the firm’s AC structure and attributes. Consistent with Roy and Mohan (2017), Musa (2018), and Hasan (2020). The Audit Committee Attributes Index (ACI) is based on the Eight (8) audit committee characteristics variables (Audit Committee Size, Audit Committee Independence, Audit Committee Meeting Frequency, Audit Committee Meeting Attendance, Audit Committee Financial Expertise, Audit Committee Gender, Audit Committee Foreign Membership, and Audit Committee Chair Independence). This study uses an unweighted approach where all the attributes have the same value and importance. This approach is more appropriate due to the same level of importance given to the selected attributes and less scope of arbitrary judgment on the relative issues (Kusumawati, 2006; Manawaduge, 2012). Consistently the ACI is constructed as follows (Roy & Mohan, 2017).
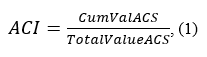
where ACI is the AC score of the firm I in year t; CumVal; ACI is the cumulative value of the AC score of firm I in year t; and the total value of AC score.
The two-stage design adopted in this study determines the proxy of FRQ in the first stage and uses it in the second stage to investigate the impact of AC on the relationship between FVA and FRQ of listed consumer goods firms in Nigeria. Therefore, the Modified Discretionary Accruals Jones Model by Kothari, et al. (2005) is used. They suggest using the Modified Jones Model after introducing an additional independent variable, the current Return on Assets, to control for the impact of firm performance on discretionary accruals. Kothari et al. (2005) model was chosen because of its advantages over the conventional DA models like the Jones model and its modified version for controlling the impact of performance when measuring the DA. As such, the inclusion of the performance construct in the model improves the accuracy or reliability of the inferences derived from research on earnings quality, and it also minimizes the issue of heteroscedasticity and misspecification errors that are attributed to accrual models (Kothari et al., 2005; Abdullah & Ku-Ismail, 2016). Under this model, total accruals are defined as follows:
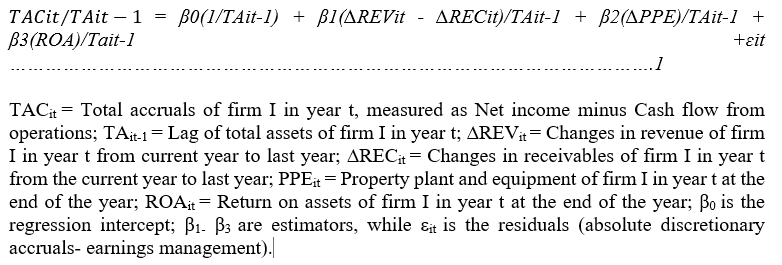
Therefore, the residuals of Model 1 represent the measure of FRQ (earnings management based on Discretionary Accruals (DA)). To measure the effects of FVA on FRQ Model 2 is used. The model is mathematically expressed as follows:
The study used model 1 to measure FRQ, which is used to determine the impact of FVA on FRQ as well as the moderating effect of AC attributes on the relationship between FVA and FRQ of listed consumer goods firms in Nigeria.
4. Results and Discussion
In the results of the study, the analysis of the results obtained from the data, the research hypotheses were also tested in this subsection. The discussion of results began with descriptive statistics, as presented in Table 4.
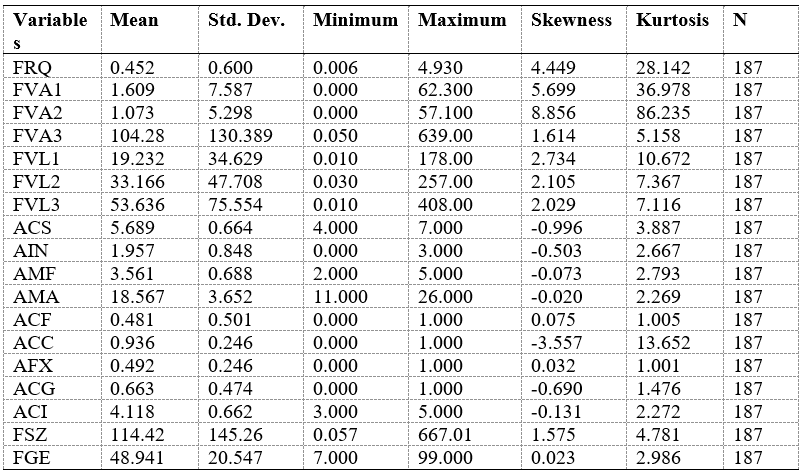
Table 4. Descriptive Statistics
Source: developed by the authors
The descriptive results from Table 4 revealed that the mean value of FRQ (Discretionary Accruals) for the sampled consumer goods firms in Nigeria is 0.452, with a standard deviation of 0.600. The mean value shows a low level of accrual quality as well as low FRQ in the sampled firms. The minimum and maximum values of FRQ are 0.006 and 4.930 respectively. The standard deviation of 0.600 indicates that there is a significant deviation of the data for FRQ from both sides of the mean value by 0.600 during the period of the study. Similarly, the table revealed that the values of skewness and kurtosis of 4.449 and 28.142 indicate that the data is not normally distributed respectively. Table 4 showed that the average value of FVA1 of the sampled consumer goods firms in Nigeria during the period of the study was N1.609billion, with a standard deviation of 7.587. The standard deviation implies that the data for FVA1 is widely dispersed from both sides of the mean by 7.587. The minimum value of the FVA1 is N0.00billion, while the maximum value is N62.30billion. The table also revealed that the data did not follow the normal distribution assumption, because of the value of skewness of 5.669 and kurtosis of 36.978. Table 4.1 also showed that the average value of FVA2 of the sampled consumer goods firms in Nigeria during the period of the study was N1.073billion, with standard deviation of 5.298. The minimum value of the FVA2 is N0.00billion, while the maximum value is N57.100billion. The standard deviation on the other hand implies that the data for FVA2 is widely dispersed from both sides of the mean value by 5.298. The table also revealed that the value of skewness of 8.856 and kurtosis of 86.235 indicates that the data did not follow the normal distribution assumption.
The descriptive statistics in Table 4 showed that the average value of FVA3 of the sampled consumer goods firms in Nigeria during the period of the study was N104.28billion, with a standard deviation of 130.389. The standard deviation implies that the data for FVA3 is widely dispersed from both sides of the mean by 130.389. The minimum value of the FVA3 is N0.050billion, while the maximum value is N639.00billion. The table also revealed that the data did not follow the normal distribution assumption, because of the value of skewness of 1.614 and kurtosis of 5.158. Table 4 also showed that the average value of FVA2 of the sampled consumer goods firms in Nigeria during the period of the study was N1.073billion, with standard deviation of 5.298. The minimum value of the FVA2 is N0.00billion, while the maximum value is N57.100billion. The standard deviation on the other hand implies that the data for FVA2 is widely dispersed from both sides of the mean value by 5.298. The table also revealed that the value of skewness of 8.856 and kurtosis of 86.235 indicates that the data did not follow the normal distribution assumption.
The results from Table 4 showed that the average value of FVL1 of the sampled consumer goods firms in Nigeria during the period of the study was N19.232billion, with a standard deviation of 34.629. The standard deviation implies that the data for FVL1 is widely dispersed from both sides of the mean by 34.629. The minimum value of the FVL1 is N0.010billion, while the maximum value is N178.00billion. The table also revealed that the data did not follow the normal distribution assumption, because of the value of skewness of 2.734 and kurtosis of 10.672. Table 4 also showed that the average value of FVL2 of the sampled consumer goods firms in Nigeria during the period of the study was N33.166billion, with standard deviation of 47.708. The minimum value of the FVL2 is N0.030billion, while the maximum value is N257.00billion. The standard deviation on the other hand implies that the data for FVL2 is widely dispersed from both sides of the mean value by 47.708. The table also revealed that the value of skewness of 2.105 and kurtosis of 7.367 indicates that the data did not follow the normal distribution assumption. Additionally, Table 4 showed that the average value of FVL3 of the sampled consumer goods firms in Nigeria during the period of the study was N53.636 billion, with a standard deviation of 75.554. The minimum value of the FVL3 is N0.010 billion, while the maximum value is N408.00 billion. The standard deviation on the other hand implies that the data for FVL3 is widely dispersed from both sides of the mean value by 75.554. The table also revealed that the skewness value of 2.029 and kurtosis of 7.116 indicate that the data did not follow the normal distribution assumption.
On the Audit Committees Attributes, Table 4 revealed that the average Audit Committee Size (ACS) of the sampled consumer goods firms during the period was 5 members (from the mean value of 5.689) with a standard deviation of 0.664, indicating that the data deviate from the mean value by 0.664. The minimum ACS was 4 members, and the maximum was 7 members. The range of AC composition signifies that on the mean, sample consumer goods firms are well composed in line with the CAMA 2020 and Nigerian Corporate Governance Code’s (2018) minimum requirements for AC membership of five for every public company. On the other hand, there are listed companies that failed to implement the minimum AC size of five. The coefficients of Skewness and Kurtosis of -0.996 and 3.887 imply that the data for the variable is not normally distributed, because the data is negatively skewed and the peakedness of the data.
The average Audit Committee Independence (AIN) of the sample d consumer goods firms during the period was 1 independent/non-executive director (from the mean value of 1.957) with a standard deviation of 0.848, indicating that the data deviated from the mean value by 0.848. The minimum AIN was 0, and the maximum was 3 independent/non-executive directors. This is also in line with the minimum requirement of CAMA 2020 that the committee should consist of at least 2 members that are NED. The coefficients of Skewness and Kurtosis of -0.503 and 2.667 imply that the data for the variable is not normally distributed, because the data is negatively skewed and the high value of kurtosis of the data. The table also showed that the average Audit Committee Meetings Frequency (AMF) of the sample d consumer goods firms during the period was 4 times during an accounting period (from the mean value of 3.561) with a standard deviation of 0.688, indicating that the data deviate from the mean value by 0.688. The minimum number of meetings was 2 times a year, and the maximum was 5 times. AC meeting frequency signifies that on the mean, sample consumer goods firms are in line with the Nigerian Corporate Governance Code’s (2018) minimum requirements for AC meetings of once every quarter for every public company. The coefficients of Skewness and Kurtosis of -0.073 and 2.793 imply that the data for the variable is not normally distributed, because the data is negatively skewed and the high value of kurtosis of the data. The table on the other hand showed that the average Audit Committee Meetings Attendance (AMA) of the sample d consumer goods firms during the period was 19 times during an accounting period (from the mean value of 18.567) with a standard deviation of 3.652, indicating that the data deviate from the mean value by 3.652. The minimum number of meetings attendance was 11 times a year, and the maximum was 26 times. The coefficients of Skewness and Kurtosis of -0.020 and 2.269 imply that the data for the variable is not normally distributed, because the data is negatively skewed and the high value of kurtosis of the data.
Table 4 also indicated that the mean value is 0.481 implying that, on average, there were, at least, 48.1% of foreign nationals (Audit Committee Foreign Membership-ACF) represented on the audit committees of listed consumer goods firms in Nigeria. The standard deviation of 0.501 indicates a significant deviation in audit committee foreign membership among the sampled consumer goods firms during the study period. ACF has a minimum value of 0 and a maximum value of 1. The table also revealed that the average Audit Committee Chair Independence (ACC) of the sampled consumer goods firms during the period was 0.936 with a standard deviation of 0.246, indicating that the data deviated from the mean value by 0.246. that is, on average, 93.6% of the audit committees are chaired by non-executive/independent directors during the period of the study. The minimum ACC was 0, and the maximum was 1. The coefficients of Skewness and Kurtosis of -3.557 and 13.652 imply that the data for the variable is not normally distributed, because the data is negatively skewed and the peakedness of the data.
The table also showed that the average audit committees’ financial expertise and competence (AFX) of listed consumer goods firms in Nigeria is 0.492 (implying that 49.2% of members are financial experts with a background in accounting and financial management). This further means that 50.8% of the audit committee members are not financial experts. The minimum AFX was 0, and the maximum was 1. AC financial experts signify that on the mean, sample consumer goods firms are below the requirement of CAMA 2020 minimum requirements for at least one member with professional qualification in Accounting for every public company (Companies and Allied Matters Act, 2020). The coefficients of Skewness and Kurtosis of 0.032 and 1.001 imply that the data for the variable is not normally distributed. Table 4 also showed that the average Audit Committee Gender Diversity (ACG) of listed consumer goods firms in Nigeria is 0.663 (implying that the firms had 66.3% women represented on the audit committees). This further means that 43.7% of the audit committee members are men. The minimum ACG was 0, and the maximum was 1. Moreover, within the firms and the study period, some firms did not have any women on their audit committees. The coefficients of Skewness and Kurtosis of -0.690 and 1.476 imply that the data for the variable is not normally distributed.
As a moderating variable and for the study to capture the multiple dimensions of the firms’ AC structure and attributes, an Audit Committee Attributes Index (ACI) was developed. The average score of ACI of the sampled consumer goods firms during the period was 4.118 with a standard deviation of 0.662, indicating that the data deviated from the mean value by 0.662. The minimum ACI was a score of 3, and the maximum was 5. The coefficients of Skewness and Kurtosis of -0.131 and 2.272 imply that the data for the variable is not normally distributed, because the data is negatively Skewed and the high value of Kurtosis of the data.
The table also indicated that the average amount of investment in the firms' Total Assets-Firm Size (FSZ) is N114.42 billion. The standard deviation of FSZ of 145.26 suggests a high level of dispersion in the total assets among the sampled firms. The reason behind this could not be far from the fact that the study covers different firms with different asset bases. The FSZ recorded a minimum of N0.057 billion and a maximum of N667.01. The coefficients of Skewness of 1.575 and Kurtosis of 4.781 imply that the data for the FSZ is not normally distributed, because the data is positively Skewed and the high value of Kurtosis of the data. Firm Age (FGE) on the other hand has a mean value of 48.94 years. The minimum age is 7 years (before the period of the study), while the maximum age is 99 years. This means that all the sampled companies were listed before the 2012 financial year. The coefficients of Skewness of 0.023 and Kurtosis of 2.986 imply that the data for the FGE is normally distributed.
The analysis of the descriptive statistics revealed that the data for the variables of the study did not follow the normal distribution assumption of parametric analysis. However, to determine the statistical evidence with regards to the data normality, the study employed the Shapiro-Wilk test for normal data. The results of the test are presented in Table 5.
Table 5. Data Normality Test
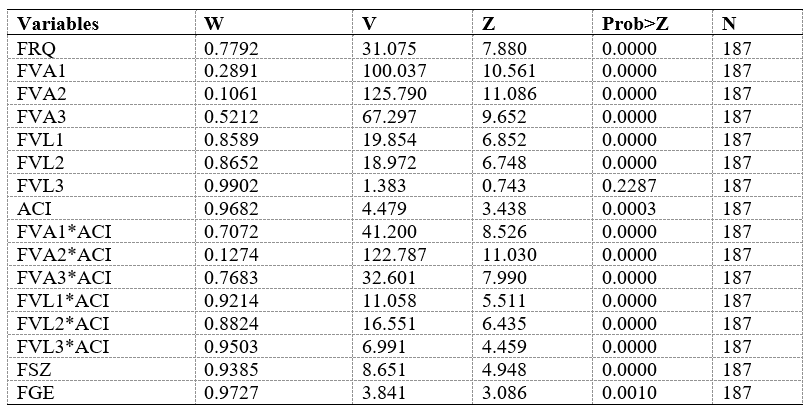
Source: developed by the authors
The Shapiro-Wilk test is a useful tool for testing normality. The null hypothesis principle is used in the Shapiro-Wilk (W) test for normal data, under the principle; the Null hypothesis that ‘the data is normally distributed’ is tested. Table 5 indicates that data from all the variables of the study are not normally distributed because the P-values are significant at a 1% level of significance (p-values of 0.0000), except the FVL3, which is not statistically significant at all levels of significance (p-value of 0.2287). Therefore, the null hypothesis (that, the data is normally distributed) is rejected for FRQ, ACI, FVA1, FVA2, FVA3, FVL1, FVL2, FVA1*ACI, FVA3*ACI, FVA3*ACI, FVL1*ACI, FVL2*ACI, FVL3*ACI, FSZ and FGE, while not rejected for the FVL3. This may lead to problems in OLS regression, hence the need for more generalized regression models. This has prompted the study to resort to SEM, because it uses techniques like Maximum Likelihood (ML), and Generalized Least Squares (GLS), and can handle complex error structures and correlations among error terms.
Table 6 shows the correlation coefficients between the dependent and the independent variables. The asterisk beside the correlation coefficient shows the coefficients' significance level. The correlation indicates the direction of the relationships as well as the strength of the relationship, values of the correlation coefficient range from -1 to 1. The sign of the correlation coefficient indicates the direction of the relationship (positive or negative), and the absolute value of the correlation coefficient indicates the strength, with larger values indicating stronger relationships.
Table 6. Correlation Matrix
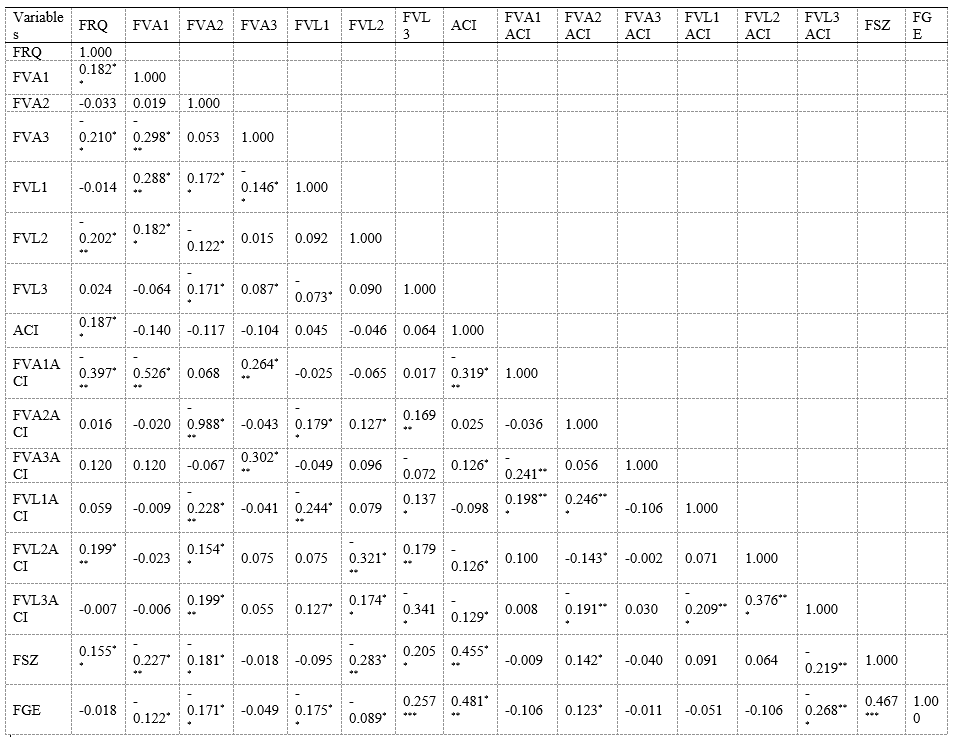
Source: developed by the authors
The correlation results in Table 6 show that FVA1 is positively related to FRQ (from the correlation coefficient of 0.182), and the relationship is statistically significant at a 5% level of significance. That is, an increase in level 1 fair value assets increases the discretionary accruals of listed consumer goods firms in Nigeria, which is an indication of poor FRQ. The table also show that FVA2 and FVL1 are negatively related to FRQ (from the correlation coefficient of -0.33 and -0.014 respectively), but the relationship is not statistically significant at all levels of significance. That is, an increase in level 2 fair value assets and level 1 fair value liabilities decreases the discretionary accruals of listed consumer goods firms in Nigeria, which is an indication of high FRQ. It also shows that FVA3 and FVL2 are statistically and negatively related to FRQ (from the correlation coefficient of -0.210 and -0.202 respectively), and the relationship is statistically significant at a 1% level of significance. That is, an increase in level 3 fair value assets and level 2 fair value liabilities decreases the discretionary accruals of listed consumer goods firms in Nigeria, which is an indication of high FRQ.
Table 6 show that there is a significant statistically positive relationship between audit committees attributes index (ACI) and FRQ of listed consumer goods firms in Nigeria (from the correlation coefficient of 0.187), and the relationship is statistically significant at a 5% level of significance. That is, an increase in the audit attributes components is related to an increase in the discretionary accruals of listed consumer goods firms in Nigeria, which is an indication of poor FRQ.
The correlation results after moderating the fair values show that there is a significant statistical negative relationship between moderated FVA1*ACI and FRQ of listed consumer goods firms in Nigeria (from the correlation coefficient of -0.397), and the relationship is statistically significant at a 1% level of significance. That is, an increase in the moderated level 1 fair value assets is related to a decrease in the discretionary accruals of listed consumer goods firms in Nigeria, which is an indication of high FRQ. Moreover, there is a negative relationship between moderated FVL3*ACI and FRQ of listed consumer goods firms in Nigeria (from the correlation coefficient of -0.007), but the relationship is not statistically significant at all levels of significance. Which suggests that an increase in the moderated level 3 fair value liabilities is related to a decrease in the discretionary accruals of listed consumer goods firms in Nigeria, which is an indication of high FRQ. The table further shows that there is a significant statistically positive relationship between moderated FVL2*ACI and FRQ of listed consumer goods firms in Nigeria (from the correlation coefficient of 0.199), and the relationship is statistically significant at a 1% level of significance. That is, an increase in the moderated level 2 fair value liabilities is related to an increase in the discretionary accruals of listed consumer goods firms in Nigeria, which is an indication of poor FRQ. The table on the other hand, shows that there is an insignificant statistically positive relationship between moderated FVA2*ACI, FVA3*ACI, FVL1*ACI, and FRQ of listed consumer goods firms in Nigeria (from the correlation coefficients of 0.160, 0.120, and 0.059 respectively), but the relationship is not statistically significant at all levels of significance. That is, an increase in the moderated level 2 fair value assets, moderated level 3 fair value assets moderated level 1 fair value liabilities are related to an increase in the discretionary accruals of listed consumer goods firms in Nigeria, which is an indication of poor FRQ.
The table also show that FSZ is positively related to FRQ (from the correlation coefficient of 0.155), and the relationship is statistically significant at 5% level of significance. That is, an increase in FSZ is related to an increases in the discretionary accruals of listed consumer goods firms in Nigeria, which is an indication of poor FRQ. The table also show that FGE is negatively related to FRQ (from the correlation coefficient of -0.018), but the relationship is not statistically significant at all levels of significance.
The correlation results revealed that level 1 fair value liabilities and level 3 fair value liabilities are value relevant to investors as they exhibited a significant positive relationship with the market values of listed consumer goods firms in Nigeria during the period of the study. Moreover, the correlation results among the independent variables confirm the absence of perfect relationships. Because no correlation coefficient is greater than 0.80 (except one) it might be a sign of multicollinearity (Gujarati 2003; Hair et al., 2006). Hence, there is an absence of multicollinearity among the independent variables of the study. Consistent with the classical regression assumptions, the study conducted some robustness tests to ensure the validity and reliability of all the statistical inferences as well as findings of the study. The tests include Data Normality (Table 5), Heteroscedasticity, Multicollinearity, Model Specification Test, and the SEM Model fit test. When these assumptions are not been met, the estimators are biased and cannot be used in drawing any inference.
This study subjected the models of the study to some robustness tests, due to the uncertainty as to the conformity with the classical regression assumptions and the panel nature of the data used. For instance, one of the classical regression assumptions is that the variance of the error terms is constant (Homoskedastic). The test conducted (Hettest- Breuch Pagan/Cook-Weisberg test) for Model 2, 3, 4 and 5 indicate a Chi-Square coefficient of 0.12 with p-value of 0.7282; 0.28 with p-value of 0.5939; 0.00 with p-value of 0.9496; 0.00 with p-value of 0.9830 respectively; confirm the absence of heteroskedasticity in all the models, that is, the variance of the error terms is constant. The explanatory variables are also expected to be not perfectly correlated (absence of multicollinearity). The results provide evidence of the absence of perfect multicollinearity among the independent variables because all the mean Variance Inflation Factors (VIF) are less than 10. The rule of thumb for the VIF is that a value of 10 and above indicates perfect multicollinearity. Hence, the Mean VIF for Models 2, 3, 4, and 5 are 1.31, 1.46, 1.84, and 1.94 respectively.
Model specification errors can arise when relevant variables are left out of the model or when irrelevant variables are included. If important variables are omitted, the shared variance they have with the included variables might be incorrectly attributed to those variables, leading to an inflated error term. Conversely, if irrelevant variables are included, the variance they share with included variables might be wrongly attributed to them. These specification errors can significantly impact the accuracy of the regression coefficients. Therefore, Linktest and Ramsey's (1969) test for model specification are employed in this study.
Model specification tests are conducted to determine whether the model that is correctly specified is devoid of any specification errors. The Ramsey Test hypothesized the non-existence of omitted variables. The test uses the powers of the fitted values of dependent variables (FRQ and MPS). The result of the test for Models 2, 3, 4, and 5 justifies that the models are well-fitted and correctly specified, hence, do not require any additional variable(s). Thus, it is revealed that the model does not suffer any misspecification or lack of functional fit. From the P-values 0.0797, 0.2207, 0.9395, and 0.0796 respectively.
Linktest on the other is based on the idea that if a regression is properly specified, one should not be able to find any additional independent variables that are significant except by chance. Linktest creates two new variables, the variable of prediction, _hat, and the variable of squared prediction, _hatsq. The model is fit if the _hat is significant since it is the predicted value, and that _hatsq should not be significant, because if the model is specified correctly, the squared predictions should not have much explanatory power. That is _hatsq must not be a significant predictor if a model is specified correctly. Consistently, the p-values of _hatsq for Models 2, 3, 4, and 5 are not statistically significant (p-values 0.268, 0.429, 0.326, and 0.816 respectively), suggesting that the models are correctly specified.
Structural Equation Modeling is a powerful statistical technique used in various fields to model complex relationships among variables. A crucial aspect of SEM is evaluating how well the proposed model fits the observed data. Model fit in SEM is a critical concept that reflects the extent to which the theoretical model accurately represents the data structure. To determine the fitness of the SEM Models the following tests are employed; Chi-Square (χ²) Test, Root Mean Square Error of Approximation (RMSEA), Standardized Root Mean Square Residual (SRMR), Comparative Fit Index (CFI), and Tucker-Lewis Index (TLI).
The Chi-Square (χ²) test for Models 2 and 3 is 7.831 with p-value of 0.082, Models 4 and 5 is 6.450 with p-value of 0.092. This test provides a direct assessment of how well the hypothesized model reproduces the observed data. Although it is sensitive to sample size, a non-significant χ² value indicates a good fit. Therefore, the models are fit as the tests are not significant at 5% level.
Root Mean Square Error of Approximation (RMSEA) evaluates the goodness of fit per degree of freedom, with values ranging between 0.06 and 0.08 indicating a good fit. The test for Models 2 and 3 is 0.076, and 0.079 for Models 4 and 5. The Standardized Root Mean Square Residual (SRMR) test represents the standardized difference between observed and predicted correlations, with values less than 0.08 suggesting a good fit. The test for Models 2 and 3 of the study is 0.0271, and 0.0122 for Models 4 and 5.
Comparative Fit Index (CFI) compares the fit of the target model to an independent model, with values above 0.95 indicating a good fit. In this study, the CFI test for Models 2 and 3 of the study is 0.985, and 0.998 for Models 4 and 5. Tucker-Lewis Index (TLI) on the other hand adjusts the normed fit index for model complexity, with values above 0.95 suggesting a good fit. For the study, Models 2 and 3 has 0.661, and 0.886 for Models 4 and 5.
The model fit indices analyzed revealed that the models of the study have a good model fit indicating that the proposed model adequately captures the relationships among variables in the data. Hence, the result is fit for analysis and hypothesis testing. The regression results obtained are analyzed and interpreted to generate findings that address the research objectives. The results are presented in Table 4.4. The table reports the results for the effects of the dependent variables under both models. They show the standardized path coefficients of the variables, their respective significance levels, and the variances explained for the direct and moderated effects model. The study examines the impact of fair value assets and liabilities on financial reporting quality, as well as the moderating effect of AC in this section, from the results in Table 7.
Tables 7. Path Coefficients Model 1 & 2
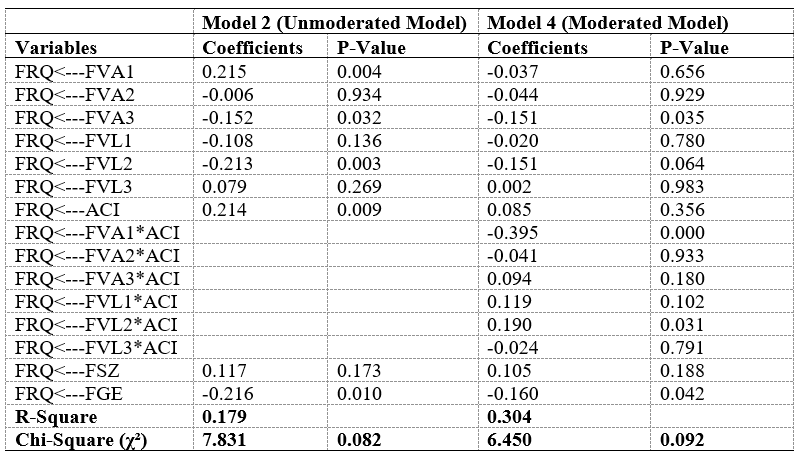
Source: Results Output from IBM AMOS
The relationship between the three fair value hierarchies and financial reporting quality of listed consumer goods firms in Nigeria from Table 7. The table present the coefficient value, and the probability value to demonstrate the direction and the strength of relationship between the variables. However, the Squared Multiple Correlation (R-Square) is used to test the cumulative effect of FVA and audit committee attributes on FRQ. The F-statistics (Chi-Square) and other fitness index were used to ascertain the fitness of the Models.
Table 7 shows the path coefficient which presents the regression results of Model 2 (Unmoderate Model) to test the relationships between the three levels of FV assets and liabilities and FRQ. The Table shows that the independent variables explained 17.9% of the total variation in the dependent variable (FRQ), from the Squared Multiple Correlation (R-Square) of 0.179. Table 4.4 reveals that the FVA1 has a significant positive effect on FRQ (proxy by Discretionary Accruals), from the coefficient 0.215 with a p-value of 0.004. This relationship is significant at the 1% level, and it implies that a unit increase in level 1 FV assets of listed consumer goods firms in Nigeria would cause an increase in the DA and subsequent increase in earnings management practices. The subsequent increase in earnings management practice by the firms would provide poor-quality financial reports. This result rejects hypothesis one (H1a) of this study that, Level 1 fair value assets have no significant effect on the financial reporting quality of listed consumer goods firms in Nigeria. This result validates the findings of prior studies (such as Xu 2013) which established that firms use FV measurements to manipulate earnings. The finding also confirmed the finding of Tutino, and Pompili (2018) who found that both financial and non-financial firms with increased exposure to FVA in financial reporting have a lower level of FRQ. The finding is also consistent with the findings of Hu et al., (2015) who found that discretionary accruals are higher for firms reporting their non-current assets at FVs. On the other hand, the result contradicts the findings of Šodan (2019). The finding also contradicts the agency theory and confirms the institutional theory that holds that the application of FVA follows regulatory pressure rather than quality reporting.
The table also reveals that the FVL1 has an insignificant negative effect on FRQ, from the coefficient -0.108 with a p-value of 0.136. This relationship is not significant at all levels, and it implies that a unit increase in level 1 FV liabilities of listed consumer goods firms in Nigeria would cause a decrease in the DA and a subsequent decrease in earnings management practices. The subsequent decrease in earnings management practice by the firms would provide higher quality financial reports. However the result is not statistically significant. The result supports hypothesis one (H1b) of this study that, Level 1 fair value liabilities have no significant effect on the financial reporting quality of listed consumer goods firms in Nigeria. This finding supports the proposition of institutional theory. The finding on the other hand contradicts the finding of Chong et al., (2012) and is inconsistent with the agency theory.
Table 7 shows that the FVA2 has an insignificant negative effect on FRQ, from the coefficient -0.006 with a p-value of 0.934. This relationship is not significant at the conventional level, and it implies that a unit increase in level 2 FV assets of listed consumer goods firms in Nigeria would cause a decrease in the DA and a subsequent decrease in earnings management practices. The subsequent decrease in earnings management practice by the firms would provide higher quality financial reports. However the result is not statistically significant. This result supports hypothesis two (H2a) of this study that, Level 2 fair value assets have no significant effect on the financial reporting quality of listed consumer goods firms in Nigeria. This finding contradicts the finding of Fargher and Zhang (2014), and the finding is in line with the institutional theory.
On the other hand, Table 7 indicates that the FVL2 has a significant negative effect on FRQ, from the coefficient -0.213 with a p-value of 0.003. This relationship is significant at the 1% level, and it implies that a unit increase in level 2 FV liabilities of listed consumer goods firms in Nigeria would cause a decrease in the DA and subsequent decrease in earnings management practices. The subsequent decrease in earnings management practice by the firms would provide higher quality financial reports. This result rejects hypothesis two (H2b) of this study that, Level 2 fair value liabilities has no significant effect on the financial reporting quality of listed consumer goods firms in Nigeria. This finding of Šodan (2015). The finding is consistent with the agency theory.
Moreover, Table 7 indicates that the FVA3 has a significant negative effect on FRQ, from the coefficient -0.152 with p-value 0.032. This relationship is significant at 5% level, and it implies that a unit increase in level 3 FV assets of listed consumer goods firms in Nigeria would cause a decrease in the DA and subsequent decrease in earnings management practices. The subsequent decrease in earnings management practice by the firms would provide higher quality financial reports. This result rejects hypothesis three (H3a) of this study that, Level 3 fair value assets have no significant effect on the financial reporting quality of listed consumer goods firms in Nigeria. This finding is contrary to those of Yao et al., (2014), and Mao et al. (2015). Additionally, the finding contradicts the Agency theory and the institutional theory.
Table 7 also shows that the FVL3 has an insignificant positive effect on FRQ, from the coefficient 0.079 with p-value 0.269. This relationship is not significant at all levels, and it implies that a unit increase in level 3 FV liabilities of listed consumer goods firms in Nigeria would cause an increase in the DA and subsequent increase in earnings management practices. The subsequent increase in earnings management practice by the firms would provide poor quality financial reports. But the result is not statistically significant. This result supports hypothesis three (H3b) of this study that, Level 3 fair value liabilities have no significant effect on the financial reporting quality of listed consumer goods firms in Nigeria. The findings support the findings of Ayres et al., (2017), and contradict the findings of Kohlbeck et al., (2016). The finding is also consistent with the Institutional theory. It is also not consistent with the findings of Yao et al., (2014).
The results from Table 7 on the Audit Committee Attributes as proxy by the Audit Committee Index (ACI) revealed to have a significant positive effect on FRQ of listed consumer goods firms in Nigeria (from the coefficient 0.214 with p-value 0.009). This relationship is significant at 1% level, and it implies that a unit increase in the attributes of audit committee (Size, Independence, Meeting Frequency, Meeting Attendance, Financial Expertise, Gender, Foreign Membership, and Chairman Independence) of listed consumer goods firms in Nigeria would cause an increase in the DA and subsequent increase in earnings management practices. The subsequent increase in earnings management practice by the firms would lead to poor quality financial reports. This is similar to the AMF, AMA, and ACG, when individual AC attributes are used, they reveal a significant positive impact on DA. While ACS, ACI, AFX, ACF and ACC show an insignificant positive impact on DA. The results are contrary to the agency theory as well as research expectation which hypothesised that the ACI could positively improve FRQ of the listed companies in Nigeria. The finding contradicts the finding of Masmoudi and Makni (2020) who found that AC attributes constrain real earnings management. The finding on the other hand supports the finding of Isa and Musa (2018) who found AC attributes have a significant effect on earnings management. It is also in line with the finding of Faozi et al. (2018) that CG mechanisms have no impact on the contribution to the quality of financial reporting. It also confirms the finding of Hazaea et al., (2020) who found that AC roles do not significantly contribute to improving the FRQ.
In this study, firm size is measured using the natural logarithm of total assets, and it is predicted to have either positive or negative association with FRQ. Table 4.4 reveals that the FSZ has an insignificant positive effect on FRQ, from the coefficient 0.117 with p-value 0.173. It signifies that a unit increase in the size of the firm would lead to an increase in the use of DA by a factor of 0.117. It shows a positive and insignificance in the relationship between FSZ and FRQ. It further suggests that as the size of a firm increases or the larger the size of a firm, the more it engages in earnings management practices. Firm Age on the other hand is considered as the number of years a firm passed since being listed on the Nigerian Exchange Group. Firm age is predicted to have either a positive or negative association with DA. The result indicates that FGE coefficient is negative and has a statistically significant value. The results in Table 4.4 indicate that there is a negative and statistically significant relationship between FGE and DA at 1% level (from the coefficient -0.216 with p-value 0.010). It further suggests that as the age of a firm increases or the older the firm, the more it engages in earnings management practices.
This section explains the moderating effects of AC attributes on the relationship between the three fair value hierarchies and financial reporting quality of listed consumer goods firms in Nigeria from Table 4.4. The Table shows that the independent variables explained 30.4% of the total variation in the dependent variable (FRQ), from the Squared Multiple Correlation (R-Square) of 0.304.
The table presents the results of the interaction model (Model 4). It turns out from the structural model that an interaction between ACI and level 1 FV assets (FVA1*ACI) appears negative but statistically significant at a 1% level (from the coefficient -0.395 with a p-value 0.000). This indicates that on average, a unit increase in the attributes of the audit committee of listed consumer goods firms would lead to a corresponding decrease in the use of discretionary accruals by a factor of 0.395. It further suggests that the presence of audit committee Size, Independence, Meeting Frequency, Meeting Attendance, Financial Expertise, Gender, Foreign Membership, and Chairman Independence in the attributes of audit committees of Nigerian corporate boards helps in curbing managerial opportunistic self-interest behavior through FV, thereby enhancing the credibility of the financial report (FRQ) of the firms. Consequently, the negative relationship between level 1 FV assets and earnings management practices has been moderated by the audit committee attributes, as the attributes monitor significantly and control the earnings management practices. Thus, this result provides evidence that Audit Committees’ Attributes moderate the relationship between FVA and FRQ of the listed Nigerian consumer firms. Besides, this result rejects hypothesis four (H4a) of this study that, audit committee attributes have no significant moderating effect on the relationships between the level 1 fair value assets and the financial reporting quality of listed consumer goods firms in Nigeria. As such, H4a is rejected. This finding contradicts the finding of Suprianto et al., (2017) who found that the variable of AC status cannot moderate the relationship between accounting experts of AC and earnings management in Indonesia. It also contradicts the finding of Kholilah et al., (2023) who found in Indonesia that CG structure strengthens management's motivation to utilize fair value for investment properties, contrary to the expected role of CG in mitigating managerial opportunistic behaviour. It is in line with the findings of Isa and Musa (2018) in Nigeria.
The results from Table 7 show that an interaction between ACI and level 1 FV liabilities (FVL1*ACI) appears negative but not statistically significant at all levels (from the coefficient 0.119 with p-value 0.102). This indicates that on average, a unit increase in the attributes of audit committee of listed consumer goods firms would lead to a corresponding increase in the use of discretionary accruals by a factor of 0.119. It further suggests that the presence of audit committee attributes in Nigerian consumer goods firms boards did not help in curbing managerial opportunistic self-interest behaviour through FV, thereby affecting the credibility of the financial report (FRQ) of the firms. Consequently, the positive relationship between level 1 FV liabilities and earnings management practices has not been moderated by the audit committee attributes, as the attributes failed to monitor significantly and control the earnings management practices. Besides, this result support hypothesis four (H4b) of this study that, audit committee attributes have no significant moderating effect on the relationships between the level 1 fair value liabilities and the financial reporting quality of listed consumer goods firms in Nigeria. As such, H4b is supported.
It turns out from the structural model that an interaction between ACI and level 2 FV assets (FVA2*ACI) appears negative but statistically insignificant at all levels (from the coefficient -0.041 with p-value 0.933). This indicates that on average, a unit increase in the attributes of audit committee of listed consumer goods firms would lead to a corresponding decrease in the use of discretionary accruals by a factor of 0.041. It further suggests that the presence of audit committee attributes of audit committees of Nigerian corporate boards did helps in curbing managerial opportunistic self-interest behaviour through FV. Consequently, the negative relationship between level 2 FV assets and earnings management practices has not been moderated by the audit committee attributes, as the attributes did not monitor significantly and control the earnings management practices. Thus, this study provides evidence that Audit Committees’ Attributes failed to significantly moderate the relationship between FVA and FRQ of the listed Nigerian consumer firms. Besides, this result supports hypothesis four (H4c) of this study that, audit committee attributes have no significant moderating effect on the relationships between the level 2 fair value assets and the financial reporting quality of listed consumer goods firms in Nigeria. As such, H4c is supported.
The results from Table 7 also show that an interaction between ACI and level 2 FV liabilities (FVL2*ACI) appears positive but statistically significant at 5% level (from the coefficient 0.190 with p-value 0.031). This indicates that on average, a unit increase in the attributes of audit committee of listed consumer goods firms would lead to a corresponding increase in the use of discretionary accruals by a factor of 0.190. It further suggests that the presence of audit committee attributes in Nigerian consumer goods firms boards did not help in curbing managerial opportunistic self-interest behaviour through FV, thereby affecting the credibility of the financial report (FRQ) of the firms. Consequently, the positive relationship between level 2 FV liabilities and earnings management practices has not been moderated by the audit committee attributes, as the attributes significantly improve earnings management practices. Besides, this result rejects hypothesis four (H4d) of this study that, audit committee attributes have no significant moderating effect on the relationships between the level 2 fair value liabilities and the financial reporting quality of listed consumer goods firms in Nigeria. As such, H6d is rejected.
It turns out from the structural model that an interaction between ACI and level 3 FV assets (FVA3*ACI) appears positive but statistically insignificant at all levels (from the coefficient 0.094 with p-value 0.180). This indicates that on average, a unit increase in the attributes of audit committee of listed consumer goods firms would lead to a corresponding increase in the use of discretionary accruals by a factor of 0.180. It further suggests that the presence of audit committee attributes of audit committees of Nigerian corporate boards did not help in curbing managerial opportunistic self-interest behaviour through FV. Consequently, the positive relationship between level 3 FV assets and earnings management practices has not been moderated by the audit committee attributes, as the attributes did not monitor significantly and control the earnings management practices. Thus, this study provides evidence that Audit Committees’ Attributes failed to significantly moderate the relationship between FVA and FRQ of the listed Nigerian consumer firms. Besides, this result supports hypothesis four (H4e) of this study that, audit committee attributes have no significant moderating effect on the relationships between the level 3 fair value assets and the financial reporting quality of listed consumer goods firms in Nigeria. As such, H4e is supported.
It turns out from the structural model that an interaction between ACI and level 3 FV liabilities (FVL3*ACI) appears negative but statistically insignificant at all levels (from the coefficient -0.024 with p-value 0.791). This indicates that on average, a unit increase in the attributes of audit committee of listed consumer goods firms would lead to a corresponding decrease in the use of discretionary accruals by a factor of 0.024. It further suggests that the presence of audit committee attributes of audit committees of Nigerian corporate boards did not helps in curbing managerial opportunistic self-interest behaviour through FV. Consequently, the negative relationship between level 3 FV liabilities and earnings management practices has not been moderated by the audit committee attributes, as the attributes did not monitor significantly and control the earnings management practices. Thus, this study provides evidence that Audit Committees’ Attributes failed to significantly moderates the relationship between FVA and FRQ of the listed Nigerian consumer firms. Besides, this result support hypothesis four (H4f) of this study that, audit committee attributes have no significant moderating effect on the relationships between the level 3 fair value liabilities and the financial reporting quality of listed consumer goods firms in Nigeria. As such, H4f is supported.
Lastly, Table 7 reveals that the FSZ has an insignificant positive effect on FRQ, from the coefficient 0.105 with p-value 0.188. It signifies that a unit increase in the size of the firm would lead to an increase in the use of DA by a factor of 0.105. It further suggests that as the size of a firm increases or the larger the size of a firm, the more it engages in earnings management practices. Firm Age on the other hand has a negative and statistically significant relationship between FGE and DA at 1% level (from the coefficient -0.160 with p-value 0.042). It further suggests that as the age of a firm increases or the older the firm, the more it engages in earnings management practices.
The results from Table 7 indicate that audit committee attributes (ACI) have a significant statistical effect on the earnings management of the sample firms in Model 2 (unmoderated) suggesting that the variable can be used as a moderator. However, a comparison of the explanatory powers of the Moderated and Unmoderated Models through R-Square; Unmoderated (0.179) and Moderated (0.304) Models indicates that the interaction between AC attributes and FV assets and liabilities accounted for 30.4% more variance than the Unmoderated single variables with 17.9%. This implies that the moderated model explains the level of FRQ in terms of earnings management better concerning the independent variables of the study when compared with the unmoderated model.
Under the unmoderated model, three of the variables (FVA1, FVA3, and FVL2) were significant in influencing FRQ. While FVA2, FVL1, and FVL3 were not significant in influencing FRQ. However, after the moderation, only two variables (FVA1 and FVL2) have a significant effect on the FRQ of the listed consumer goods firms. However, other variables such as FVA2, FVA3, FVL1, and FVL3 have no significant effects on FRQ. Moreover, the direction of the moderated variables changes after the moderation, as well as the level of significance of the variables. This implies that the variables significantly affect FRQ better when they are moderated with the audit committee. Another interesting finding from this moderation is that the direction of the relationships on the moderated variables changes. FVA1, which is positively related to earnings management, became negatively related when moderated with the audit committee. Also, FVL2, which has a negative influence on earnings management before moderation, became positively related to earnings management after it was moderated with the audit committee. FVA3, which had a significant negative influence on earnings management before moderation, became insignificant and positively related to earnings management after it was moderated with the audit committee. FVL1, which had a negative influence on earnings management before moderation, became positively related to earnings management after it was moderated with the audit committee. Lastly, FVL3 which has a positive influence on earnings management before moderation became negatively related to earnings management after it was moderated with the audit committee.
The findings extend the distinct existing body of knowledge on the FVA and FRQ as established by Alaryan et al. (2014), who found an increase in financial statement manipulations post-FV application. In Nigeria, Ijeoma (2014) discovered that FVA provides more useful information than historical cost reporting but faces challenges due to Nigeria’s capital market structure. The study suggested that Level 2 estimates were considered useful, while Level 3 estimates were seen as opportunistic. Mao et al. (2015) in China found that Level 1 and 2 FVs were associated with reduced information asymmetry, while Level 3 FVs had the opposite effect. However, self-selection bias may have influenced the results. Abubakar et al., (2015) found that that FVA has significantly positively affected the earnings quality of deposit money banks in Nigeria. Specifically, the study concludes that FVA improves earnings persistent and the predictive ability of earnings. On the contrary, the study concludes that FVA did not improve earnings quality in terms of earnings smoothing.
Similarly, Elfaki and Hammad (2015) in Khartoum Stock Exchange Market found FVA is positively impacted decision-making and reliability of financial information but relied on qualitative methods and respondent opinions. Šodan (2015) in Eastern European banks concluded that increased FV exposure was associated with lower aggregate earnings quality due to more subjective valuation techniques in less liquid markets. Daifei et al. (2015) found that Level 1 FVs improved predictability, while Level 2 and 3 FVs weakened it. The study also noted that country-wide institutional structures influenced FV predictability. Badia et al. (2016) found that higher proportions of Level 2 and 3 FVs were associated with more conditionally conservative reporting, especially when evaluated by knowledgeable investors and independent third parties. Mwapula (2016) found positive relationships between board and auditor independence and FV levels, but negative associations with board compensation and share ownership. Mauro et al. (2017) found that FV reporting generally improved earnings quality, though FV recognized through other comprehensive income was less significant. Ayres et al. (2017) found no significant relationship between FV intensity and forecast accuracy, possibly due to the financial crisis affecting market prices. Lin et al. (2017) found that restatements were positively associated with Level 3 FV assets, driven by both estimation errors and managerial manipulation. Tutino and Pompili (2017) found a correlation between FV hierarchy and market capitalization but noted varying results for different regions. Tutino and Pompili (2018) confirmed a negative correlation between extensive FV use and earnings quality, stronger in the U.S.
Lilien et al. (2018) found that Level 3 FV estimates were used for earnings smoothing but not associated with long-term market returns. Nnenna and Ugwoke (2019) found a significant improvement in earnings conservatism post-IFRS adoption, but no significant changes in overall earnings quality or accrual quality. Oladipupo and Rekiat (2020) found a significant relationship between FVA variables and earnings quality. Shehu (2020) highlights that Level 3 FVM is prone to manipulation and affects financial reporting quality. Chukwu et al. (2020) found no significant association between FV gains/losses and earnings quality, suggesting a need for better training on accounting for financial instruments. Dudycz and Prazników (2020) found that these measures are controversial and prone to manipulation, negatively affecting the reliability of financial reports. Ghio et al. (2020) noted that while FV estimates are often value-relevant, their impact varies by input level and is influenced by factors like managerial intent and market conditions. Ehalaiye, Tippett, and Zijl (2020) found that FV levels had predictive value for cash flows and earnings, with limited impact from the Global Financial Crisis. Samih et al. (2020) found that unrealized gains and losses had high predictive power for earnings quality.
Thesing and Velte (2021) reviewed 48 studies to investigate the influence of FVM on earnings quality and the moderating impact of CG, finding mixed results and recommending further focus on governance variables. Adeyemi and Kargi (2022) examined the impact of FVM hierarchy disclosures on cosmetic accounting in Nigerian banks from 2012-2018. The study found that Levels 1 and 2 reduce earnings manipulation, while Level 3 increases it. Osanyinbi et al. (2023) investigated FVM's impact on financial reporting quality in Nigerian insurance companies, finding significant positive effects and recommending better adherence to financial reporting standards. Etim et al. (2023) found that fair valuation, especially Levels 2 and 3, is significantly used to manage earnings. Ye et al. (2023) found a negative association, noting that market institutions play a role in the valuation usefulness of fair values. Nugraheni (2023) examined the impact of CG on opportunistic behavior through fair value measurement in Indonesia, finding that certain governance mechanisms can reduce opportunistic behavior. Husein et al. (2023) reviewed how FVM impacts earnings management across different industries, noting varied effects based on company type and adherence to different valuation concepts.
Song et al. (2010) found that Level 1 and Level 2 FVs are more relevant than Level 3 FVs. Strong CG improved the value relevance of FVs, especially Level 3. Hu et al. (2015) found a positive relationship. They suggested that choosing auditors and strengthening CG could constrain opportunistic behavior. Tama-Sweet and Zhang (2015) found that FV assets are generally more relevant than non-FV assets, especially in recession periods. Strong CG was associated with higher value relevance. Savitri (2016) explored the moderating role of independence on the relationship between CG mechanisms and the quality of financial statements in Indonesia, finding that independence fully moderated some relationships but not others.
Suprianto et al. (2017) found that accounting expertise negatively impacted earnings management, but AC status did not moderate this relationship. Siekkinen (2017) in European financial firms found that board independence and gender diversity increased value relevance, especially for Level 3 FVs. Hasan (2020) in Bangladesh, found that both IFRS adoption and CG strength were negatively related to earnings management, with governance moderating this relationship. Mechelli and Cimini (2020) found that IFRS 9 provides more value-relevant information in high-quality CG environments. Siyal et al. (2020) in Pakistan, found that AC independence improves the effectiveness of board structure in controlling earnings management.
5. Conclusions
- Conclusions
The study concludes that managers use fair value accounting as a tool for earnings management in listed consumer goods firms in Nigeria. It finds that fair value accounting has a significant relationship with financial reporting quality, as measured by earnings management (proxied by the level of discretionary accruals). Specifically, Level 3 fair value assets and Level 2 fair value liabilities have a significant negative effect on discretionary accruals in the sampled firms. In contrast, Level 1 fair value assets exhibit a significant positive effect on discretionary accruals in consumer goods firms. Furthermore, the study observes that fair value measurement influences earnings management regardless of the hierarchy level of assets or liabilities. Additionally, the study finds that audit committee attributes have a significant negative effect on the financial reporting quality of listed consumer goods firms in Nigeria. This aligns with institutional theory, which suggests that audit committees often perform ceremonial roles rather than effectively monitoring financial reporting processes. Furthermore, the study establishes that audit committee attributes significantly moderate the relationship between fair value accounting and financial reporting quality. Specifically, audit committees have a significant positive moderating effect on the relationship between Level 1 fair value assets and financial reporting quality. Conversely, audit committee attributes exert a significant negative moderating effect on the relationship between Level 2 fair value liabilities and financial reporting quality. However, the study finds no significant moderating effect of audit committee attributes on the relationship between Level 2 fair value assets, Level 3 fair value assets, Level 1 fair value liabilities, Level 3 fair value liabilities, and financial reporting quality. Future research should focus on the impact of reclassifications of fair value assets and liabilities on financial reporting quality. It is suggested that future research on fair value accounting should perform case studies of firms with significant Level 2 and Level 3 assets and liabilities to understand their impact on financial reporting quality.
5.1 Recommendations
Based on the findings and conclusions, the study recommends that FRCN and SEC should establish an advantageous active market for assets and liabilities in Nigeria to enable an objective measurement of level 2 and level 3 assets and liabilities at fair value. The study also recommends that regulators should require firms to disclose and explain in detail the nature and volume of management’s estimate and judgments in level 2 and level 3 fair value assets and liabilities. It is also recommended that the IASB should reconsider the second post-implementation review of IFRS 13 for adjustments to the standard, including expanded disclosures for level 2 and level 3 fair value assets and liabilities. Moreover, the board of directors of listed consumer goods firms and regulators should intensify supervision and monitoring to ensure compliance with the statutory requirement of 5 minimum membership of audit committees and minimum number of meetings of 4 times a year. Financial Reporting Council should consider a dual measurement system (fair value measurement and historical cost measurement system), pending when the active market for most of the assets and liabilities is fully operational in Nigeria. Thus, dual measurement could therefore deliver more decision useful information to financial statement users.
Acknowledgements
TETFUND
Conflict of Interest
None.
References
Abubakar, A. A. (2018). The impact of fair value accounting on the relevance of accounting information in Nigerian banks and insurance firms. International Journal of Economics and Finance, 10(3), 35–51.
Abubakar, S., Abubakar, M., & Iliyasu, H. (2015). Effect of fair value measurement on earnings persistence, earnings smoothing and accruals levels of listed deposit money banks in Nigeria. Journal of Finance and Accounting Research, 7(1), 1–33.
Andrejcik, D., Singh, G., & Halari, A. (2021). Fair value accounting: Perspective on stewardship function. Journal of Accounting and Taxation, 13(4), 226–242.
Adeyemi, S. B., & Kargi, H. S. (2022). Fair value measurement hierarchy disclosures and cosmetic accounting in Nigerian banks. African Journal of Accounting, Economics, Finance, and Banking Research, 18(2), 112–130.
Alaryan, S., Hassan, M. K., & Maroney, N. (2014). The impact of fair value accounting on financial statement manipulations. Journal of Accounting and Public Policy, 33(1), 1–22.
Ayres, D., Huang, X., & Myring, M. (2017). Fair value intensity and forecast accuracy: Evidence from financial institutions. Journal of Accounting, Auditing & Finance, 32(4), 577–600.
Badia, M., Duro, M., Jorgensen, B., & Ormazabal, G. (2016). Conditionally conservative fair value measurements. Journal of Accounting and Economics, 62(1), 95–112.
Companies and Allied Matters Act, 2020 (Nigeria).
Chong, B. S., Lu, C., & Ong, T. S. (2012). Earnings management through fair value accounting: An empirical study of U.S. commercial banks. Review of Accounting Studies, 17(3), 645–673.
Chukwu, G., Emeni, F., & Uchenna, E. (2020). Fair value gains and losses: Implications for earnings quality. Journal of Financial Reporting and Accounting, 18(1), 92–108.
Daifei, L., Xue, W., & Yufen, Z. (2015). Fair value accounting and earnings predictability: Evidence from China. China Journal of Accounting Studies, 3(2), 150–167.
Du, X., et al. (2014). The value relevance of fair value accounting: Evidence from asset transfers. Journal of Accounting Research, 52(5), 1075–1114.
Dudycz, T., & Prazników, K. (2020). Fair value controversy: Accounting reliability versus earnings manipulation. Accounting and Business Research, 50(4), 456–478.
Ehalaiye, D., Tippett, M., & van Zijl, T. (2020). Predictive value of fair value levels on cash flows and earnings. Accounting and Finance, 60(2), 1491–1518.
Elfaki, M. A., & Hammad, S. M. (2015). The impact of fair value accounting on decision-making: Evidence from Khartoum Stock Exchange. International Journal of Accounting and Financial Reporting, 5(1), 28–44.
Etim, R. S., Obiora, J. C., & Akpan, S. (2023). Fair valuation and earnings management in Nigerian banks. International Journal of Financial Research, 14(2), 1–18.
Fargher, N., & Zhang, H. (2014). The impact of fair value accounting on earnings quality: Evidence from U.S. banks. Journal of Banking & Finance, 42(3), 92–105.
Freeman, R. A., et al. (2017). The value relevance of fair value accounting in U.S. banks. Journal of Accounting Research, 55(1), 1–46.
Goh, J. P., et al. (2015). The value relevance of fair value accounting in U.S. banks. Accounting and Finance, 55(2), 247–280.
Ghio, A., Filip, A., & Jeny, A. (2020). Fair Value Disclosures and Fair Value Hierarchy: Literature Review on the Implementation of IFRS 13 and SFAS 157, 1–34. http://www.fasb.org/cs/.
Hasan, M. M. (2020). The moderating role of corporate governance on fair value accounting and earnings management in Bangladesh. Journal of Asian Business Studies, 14(1), 89–106.
Hu, J., et al. (2015). The association between asset revaluations and discretionary accruals in Australian firms. Accounting and Finance, 55(2), 281–310.
Hu, K., Liu, J., & Tian, G. (2015). Fair value accounting and corporate governance: The role of auditor choice. Journal of Corporate Finance, 31(2), 105–120.
Husein, S. M., Omar, M., & Tarmizi, R. (2023). Industry-based analysis of fair value measurement and earnings management. Journal of Financial and Quantitative Analysis, 58(3), 431–456.
Ijeoma, N. B. (2014). The contribution of fair value accounting to financial reporting in Nigeria. International Journal of Financial Research, 5(3), 50–63.
Lilien, S., Liang, H., & Riedl, E. (2018). The role of Level 3 fair values in earnings management. Accounting Horizons, 32(4), 29–51.
Mao, M., Zhang, Y., & Wang, H. (2015). The impact of fair value hierarchy on financial reporting quality in China. Chinese Accounting Review, 18(3), 45–67.
Mauro, A., Romano, G., & Tutino, M. (2017). The impact of fair value hierarchy on earnings quality: Evidence from the EU banking sector. Journal of Financial Stability, 30(1), 105–124.
Mechelli, A., & Cimini, R. (2020). IFRS 9 and fair value accounting in high-quality corporate governance environments. Accounting in Europe, 17(2), 200–222.
Nnenna, O. C., & Ugwoke, B. (2019). Fair value accounting and earnings conservatism: Evidence from post-IFRS adoption in Nigeria. International Journal of Business and Management, 14(4), 120–134.
Oladipupo, A., & Rekiat, K. (2020). The effect of fair value accounting on earnings quality in Nigeria. Accounting Research Journal, 33(2), 89–104.
Osanyinbi, T. A., Alade, S. A., & Agunbiade, A. A. (2023). Fair value measurement and financial reporting quality: Evidence from Nigerian insurance companies. African Journal of Business Management, 17(1), 75–91.
Palea, A. (2013). Fair value accounting: A review of the literature. Journal of Accounting Literature, 32(1), 1–46.
Pompili, M., & Tutino, M. (2019). The impact of fair value accounting on earnings quality: A European perspective. Accounting in Europe, 16(3), 321–345.
Pompili, M., & Tutino, M. (2019). Fair Value Accounting and Earning Management: The Impact of Unobservable Inputs on Earning Quality. Evidence from the US, 16(2), 8–18. https://doi.org/10.22495/cocv16i2art1
Reid, W. (2014). The impact of ASC 820-10 on fair value accounting. Accounting Horizons, 28(4), 815–836.
Šodan, S. (2019). Fair value measurement hierarchy and earnings volatility in Eastern European banks. Accounting and Business Research, 49(4), 92–118.
Song, C. J., Thomas, W. B., & Yi, H. (2010). Value relevance of FVA levels: The role of corporate governance. The Accounting Review, 85(4), 1345–1373.
Thesing, J., & Velte, P. (2021). Do Fair Value Measurements Affect Accounting-Based Earnings Quality? A literature review with a focus on corporate governance as moderator. Journal of Business Economics, (February), 40.
Usman, M. A., et al. (2017). The influence of corporate governance on the valuation of other comprehensive income in Nigeria. International Journal of Economics and Finance, 9(2), 18–34.
Wang, Y., et al. (2017). The value relevance of fair value accounting in Chinese firms. Accounting and Finance, 57(2), 237–264.
Nigerian Corporate Governance Code. (2018). Retrieved from https://pwcnigeria.typepad.com/files/nigerian-code-of-corporate-governance-2018-1.pdf
Nugraheni, B. L. Y. (2023). The Impact of Corporate Governance Mechanism on Fair Value Measurement in the Indonesian Banking and Financial Industries. Jurnal Dinamika Akuntansi Dan Bisnis, 10(2), 163–180. https://doi.org/10.24815/jdab.v10i2.28355
Recebido: 01/06/2025
Aceito: 07/07/2025
----------
Notas
[1] Department of Accounting, Faculty of Management Sciences, Bayero University, Kano, Nigeria. https://orcid.org/0000-0002-3655-0421 E-mail: kidandago@gmail.com
[2] Department of Accounting, Faculty of Management Sciences, Bayero University, Kano, Nigeria. https://orcid.org/0000-0003-3143-5720 E-mail: amodibbo8@gmail.com
